
Time to Focus: Behaviour in our Classrooms
About this resource:
Good classroom behaviour is critical for creating learning environments in which students can learn and achieve, and teachers can be most effective. But ensuring positive behaviour isn’t just up to schools – it requires shared responsibility and deliberate, joint actions. This report describes the challenging behaviours teachers face in schools, the impact of those behaviours, and recommendations for action. Our companion good practice report also shares examples of how teachers and schools can effectively manage behaviour.
Related insights
Explore related documents that you might be interested in.
-
 Good practice report | 60 min read
Good Practice: Behaviour in our Classrooms
28 March 2024 -
 Research summary | 10 min read
Time to Focus: Behaviour in our Classrooms - Summary
28 March 2024 -
 Good practice guide | 30 min read
Guide for Teachers: Behaviour in our Classrooms
28 March 2024 -
 Good practice guide | 30 min read
Guide for Leaders: Behaviour in our Classrooms
28 March 2024 -
 Sector insights | 4 min read
Insights for School Boards: Behaviour in our Classrooms
28 March 2024
Read Online
Executive summary
Good classroom behaviour is critical for creating learning environments in which students can learn and achieve, and teachers can be most effective. But ensuring positive behaviour isn’t just up to schools – it requires shared responsibility and deliberate, joint actions.
This report describes the challenging behaviours teachers face in schools, the impact of those behaviours, and recommendations for action. Our companion good practice report also shares examples of how teachers and schools can effectively manage behaviour.
Behaviour in schools impacts on learning
Classroom behaviour impacts the learning of all students. Maintaining good behaviour in school classrooms is crucial for creating an environment where students can learn and achieve. In classes with positive behaviour, teachers are able to better use their time teaching, and less time reacting to and managing behaviours. This places far less strain on their health and enjoyment of the job, allowing them to teach at their best. For students, better behaviour in classrooms means less disruptions, allowing them to focus on learning.
ERO has looked at the behaviour in classrooms in Aotearoa New Zealand and how this is changing
This evaluation report sets out what ERO has found about behaviour in classrooms and the impact of behaviour on students and teachers. The companion good practice report shares practical strategies for teachers and leaders to support improvements in managing challenging behaviour in their schools.
Key findings
1. Behaviour is a major problem in Aotearoa New Zealand schools, and it is worse than other countries.
- Half of teachers have to deal with students calling out and distracting others in every lesson.
- A quarter of principals see students physically harming others and damaging or taking property every day.
- PISA results over the last 20 years show that Aotearoa New Zealand’s classrooms have consistently had worse behaviour compared to most other OECD countries. For example, Aotearoa New Zealand is lowest among OECD for behaviour in maths classes and in the bottom quarter of PISA countries for behaviour in English classes.
2. Student behaviour has become worse in the last two years.
- Over half of teachers report all types of behaviour have become worse. In particular, they report a greater number of students displaying challenging behaviour.
3. Behaviour is significantly damaging student learning and achievement.
- Almost half (47 percent) of teachers spend 40-50 mins a day or more responding to challenging behaviour. This limits the time available to teach.
- Three-quarters of teachers believe student behaviour is impacting on students’ progress.
- International evidence (PISA) links behaviour and achievement, finding students in the most well-behaved maths classes scored significantly higher than all other students, and students in the worst-behaved classes scored the lowest.
4. Behaviour is significantly impacting student enjoyment of school and therefore attendance.
- Two-thirds of teachers (68 percent) and principals (63 percent) find that challenging behaviour in the classroom has a large impact on student enjoyment. Enjoyment of school is a key driver of attendance.
5. Behaviour is a key driver of teachers leaving teaching.
- Behaviour impacts on teacher wellbeing through mental health, physical health, and stress.
- Half of teachers (50 percent) say this has a large impact on their intention to stay in the profession.
6. Behaviour is associated with negative life outcomes.
- Student behaviour is sometimes managed through being stood-down (not allowed to attend school). These students have worse life outcomes.
- Students with three or more stand-downs are less than a third as likely to leave school with NCEA Level 2 (22 percent) than those with no stand-downs (73 percent).
- Experiencing stand-downs is linked to other longer-term outcomes such as unemployment, offending, and poor health.
- The younger a student’s first stand-down, suspension, or exclusion, the more likely they are to receive a benefit, have lower income, have a greater number of admissions to emergency departments, offend, or receive a custodial sentence.
7. Behaviour issues are particularly severe in large schools and schools in low socioeconomic communities.
- Teachers at larger schools see challenging behaviour more often, such as refusal to follow instructions (75 percent of teachers at large schools see this every day, compared with 65 percent of teachers at small schools).
- Teachers from schools in low socioeconomic communities also see challenging behaviour more often, such as damaging or taking property (40 percent see this at least every day, compared to 23 percent from schools in high socioeconomic communities), reflecting the additional challenges in these communities.
8. Teachers are not all well prepared to manage behaviour.
- Less than half (45 percent) of new teachers report being capable of managing behaviours in the classroom in their first term.
- Older new teachers (aged 36 and above) are more prepared to manage behaviour in their first term teaching than teachers aged 35 or younger.
9. Many teachers and principals struggle to access the expert support they need, particularly in secondary schools and schools in low socioeconomic communities.
- Half of teachers (54 percent) and three-quarters of principals (72 percent) find timely advice from experts to be an important support, yet four in 10 (39 percent) teachers and half of principals (49 percent) find it difficult to access.
- Teachers at secondary school feel the least supported, and that their behavioural policies and procedures are the least effective and applied the least consistently.
10. Teachers struggle to find the time to respond to behaviour.
- Over half of teachers (53 percent) and principals (60 percent) find it difficult to access the time they need to tackle behaviour issues.
11. There are inconsistencies in behaviour management within schools and between schools.
- One in four teachers (25 percent) report that their school’s behaviour policies and procedures are not applied consistently at their school. But just 2 percent of principals think they are not applied consistently.
Evidence-based practice
Effective behaviour management uses a combination of ‘proactive’ and ‘reactive’ strategies.
We reviewed international and local evidence to find the most effective practices for managing challenging behaviour in schools. These evidence-based strategies are a combination of ‘proactive’ (preventing challenging behaviour) and ‘reactive’ (responding to challenging behaviour) approaches.
Table 1: Evidence-based practice areas
|
Proactive |
Practice area 1 |
Know and understand students and what influences their behaviour This involves teachers sourcing information about the range of factors that influence student behaviour. These include past behaviours and incidents, attendance and achievement information, individual needs, and family or wider community contexts. Knowing about these influences equips teachers to understand classroom behaviours and choose effective strategies. |
|
|
Practice area 2 |
Use a consistent approach across the school to prevent and manage challenging behaviour A whole-school approach to behaviour management means all staff and students have shared understandings and clear expectations around behaviour. A whole-school approach includes training on how to implement agreed behaviour management strategies, and careful monitoring across the school through systematically tracking behaviour data. |
|
|
|
Practice area 3 |
Use strategies in the classroom to support expected behaviour Classroom strategies for managing behaviour start with setting high behavioural expectations and clear, logical consequences for challenging behaviour. These are developed and implemented with students, documented, discussed often, and consistently applied. The classroom layout (e.g. seating arrangements, visual displays) aligns with these expectations. |
||
|
Practice area 4 |
Teach learning behaviours alongside managing challenging behaviour This involves explicitly teaching students positive classroom behaviours like listening to instructions, working well with classmates, monitoring their own behaviour, and persisting with classroom tasks. Setting students up with positive learning behaviours reduces the need to manage challenging behaviour. |
||
|
Reactive |
|||
|
Practice area 5 |
Respond effectively to challenging behaviour This involves teachers being confident in a range of effective responses to challenging behaviour. Strategies include clear and immediate feedback to correct minor challenging behaviours like talking at inappropriate times, as well as logical consequences for more serious or recurring behaviours. |
||
|
Practice area 6 |
Use targeted approaches to meet the individual needs of students Targeted approaches are intended for students with the most challenging behaviour. Leaders and teachers work with experts and parents and whānau to plan and implement specific strategies for individual students, that align with the whole-school behaviour management approach. |
Recommendations
ERO has 16 recommendations, set out below.
Cross-cutting: Moving to a national approach.
Recommendation 1: Prioritise classroom behaviour and move to a more national approach to support all schools to prevent, notice, and respond to challenging behaviours effectively. This needs to include a more consistent set of expert supports and programmes for schools, based off a stronger evidence base of what is effective.
Area 1: Increase accountability and set clear expectations
Recommendation 2: ERO to include a sharper focus in its reviews of schools on schools’ behavioural climate, policies, and plans for managing behaviour.
Recommendation 3: Provide national guidance to school boards on clear minimum expectations of the behaviour climate, and for boards to set clear expectations for behaviour across their schools and ensure that these are understood by teachers and parents and whānau.
Area 2: Greater prevention
Recommendation 4: Increase in-school and out-of-school support that identifies and addresses underlying causes of behaviour, e.g. intensive parenting support, access to counselling to reduce anxiety, and support to develop individualised behaviour plans.
Recommendation 5: Examine school size and structures within larger schools – noting that behaviour in large schools is more of a problem than in smaller schools.
Recommendation 6: Support schools to monitor behaviour, identify issues early, and ensure information on prior behaviour is passed between settings (e.g. early learning to schools, primary to secondary).
Recommendation 7: Support schools to adopt evidence-based practices that promote positive behaviour and increase consistency of how behaviour is managed within the school.
Area 3: Raising teachers’ capability
Recommendation 8: Increase the focus on managing behaviour as part of Initial Teacher Education (building on the practice of the Initial Teacher Education providers who do this well) and within the first two years of induction of beginning teachers, and within the Teaching Standards (Teaching Council).
Recommendation 9: Increase recruitment of more mature Initial Teacher Education students who are better able to manage behaviour.
Recommendation 10: Prioritise evidence-based professional learning and development for teachers on effective approaches to managing behaviour and consider nationally accredited professional learning and development.
Area 4: Greater investment in effective support
Recommendation 11: Increase availability of specialist support for students (e.g. educational psychologists, this will require increasing supply).
Recommendation 12: Identify and grow the most effective (and value for money) supports and programmes and embed these consistently in all schools, including evaluating the effectiveness of current programmes (such as Positive Behaviour for learning).
Recommendation 13: Review the learning support workforce and funding models to ensure schools and teachers can access the right supports at the right time.
Recommendation 14: Prioritise support for schools with the largest behavioural issues, including larger schools and schools in low socioeconomic communities.
Area 5: Effective consequences
Recommendation 15: Provide clear guidance to schools on what the most effective consequences for challenging behaviour are and how to use them to achieve the best outcomes for students.
Recommendation 16: Ensure suspensions remain a last resort and that they trigger individual behaviour plans and the support needed for successful changes of behaviour.
About this report
Teachers in New Zealand schools face significant behaviour challenges, and this has impacts on students. Challenging behaviour in classrooms is linked to lower engagement, achievement, and enjoyment of learning. It also has large impacts on teachers and school staff. Strong school policies and procedures, skilled teachers, and external support are required to address these challenges.
This report describes the behaviour teachers face in schools and the impact of these behaviours, across school staff and students. It is part of a set of two reports – our companion good practice report sets out practices and examples of how teachers and schools can effectively manage behaviour.
The Education Review Office (ERO) is responsible for reviewing and reporting on the performance of early learning services, kura, and schools. As part of this role, ERO looks at how the education system supports schools to provide quality education for students. In this case, we looked at how classroom behaviour going is currently, and what good practice for behaviour management looks like.
To help us know what good looks like, and know what matters for managing behaviour, we worked closely with an Expert Advisory Group with a range of expertise. The group included academics, educators, practitioners, and sector experts.
This report describes what we found about the current state of behaviour in New Zealand classrooms. To do this, we drew on the experiences of school staff, students, parents and whānau, and key experts. We describe the type, frequency, and severity of classroom behaviour, how this has changed over time, and the impacts on students, school staff, and parents and whānau. We provide examples of good practice in behaviour management, and responses that we heard are working well in classrooms across the country. We also suggest areas for improvement so schools and staff can better manage behaviour in schools, ensuring enhanced learning outcomes for all students.
What we looked at
We wanted to understand the behaviours schools are facing, as well as give them clear guidance in how best to manage these behaviours to better support focused learning.
This evaluation report looks at the current state of behaviour in schools. Our companion good practice report sets out what good practice looks like for managing classroom behaviours. Across this work, we answered five key questions.
- What are the challenging behaviours teachers face in the classroom?
- How has this changed over time?
- What is the impact of these behaviours on:
- teachers and principals?
- students and parents and whānau?
- What are the long-term impacts on students of existing responses? (i.e., stand-downs, suspensions, exclusions)?
- What does the evidence show are the effective practices?
- How does this look at different stages of the school system?
- What does this look like in practice in NZ schools?
- What needs to be in place to enable good practice?
- How are schools and teachers supported to manage challenging behaviour and what would make a difference?
What about bullying?
Bullying is a very specific form of behaviour (it is deliberate, harmful, involves a power imbalance, and has an element of repetition), which is not the focus of this evaluation. For dedicated resources on bullying in Aotearoa New Zealand schools, including a student voice resource, see ERO’s 2019 research: Bullying Prevention and Response in New Zealand Schools May 2019 | Education Review Office (ero.govt.nz)
Where we looked
We focused our investigation on experiences of schools, teachers, students and parents and whānau across Aotearoa New Zealand in English-medium state and state-integrated primary, intermediate, and secondary schools (we did not include specialist schools).
How we found out about the current state of behaviour in classrooms and what effective practice looks like
We have taken a robust, mixed-methods approach to deliver breadth and depth in this evaluation. We built our understanding of the current state of behaviour and what is good practice through:
- surveys of 1557 teachers
- surveys of 547 principals
- focus groups with:
- school staff
- students
- parents and whānau participants
- Resource Teachers: Learning and Behaviour (RTLBs) from two clusters
- site visits and online sessions with 10 schools
- an in-depth review of literature, including Education Endowment Foundation research(2)
- Ministry of Education statistics on the frequency of stand-downs, suspensions, exclusions, and expulsions.
Analysing data in the Integrated Data Infrastructure
The Social Wellbeing Agency use the Integrated Data Infrastructure (IDI) to describe the future outcomes of people who experienced stand-downs, suspensions, and exclusions. We draw on their data and analysis in this report, and worked with them to understand the outcomes associated with these measures.
More details about our methodology are in Appendix 1.
Report structure
This report is divided into eight chapters.
- Chapter 1 sets out the context of how behaviour management works in Aotearoa New Zealand schools.
- Chapter 2 describes the challenging behaviours in classrooms.
- Chapter 3 describes how classroom behaviour is changing.
- Chapter 4 describes the impact of classroom behaviours on students, teachers, and principals.
- Chapter 5 describes longer term outcomes for students who have very challenging behaviours.
- Chapter 6 describes the challenges for teachers managing classroom behaviours.
- Chapter 7 sets out good practice in managing classroom behaviours. (More detail can be found in our companion good practice report.)
- Chapter 8 shares our key findings and areas for action.
|
We appreciate the work of all those who supported this research, particularly the teachers, school leaders, students, parents and whānau, and experts who shared with us. Their experiences and insights are at the heart of what we have learnt. |
Chapter 1: Context
Good classroom behaviour is a critical factor for creating learning environments in which students can learn and achieve, and where teachers can be most effective. But positive behaviour isn’t just up to the students or even their schools – it requires shared responsibility and joint actions. Managing classroom behaviour involves the whole education system and support structure, as well as the school community, school leadership, staff, and parents and whānau.
There are a range of measures that teachers can take in preventing and managing challenging behaviour in the classroom. These go alongside a range of interventions available to school staff to assist with behaviour management.
This chapter sets out:
- why it is important to have good behaviour in classrooms
- how teachers in Aotearoa New Zealand deal with classroom behaviours
- what stand-downs, suspensions, exclusions, and expulsions are, and when schools use them.
1) Why is good behaviour in classrooms important?
Maintaining good behaviour in school classrooms is crucial for creating a positive and engaging learning environment where students can learn and achieve.(1) When this happens teachers are able to better use their time teaching, and less time reacting to and managing behaviours. As a result, students progress and enjoy their learning more.(2) For teachers, positive classroom behaviour climates place far less strain on their own health and enjoyment of the job, allowing them to teach at their best.(3) For schools, better behaviour in classrooms means less disruptions, allowing staff and students to focus on learning outcomes and foster a greater sense of community and positive school culture.(4)
What influences behaviour?
There is a wide range of research and evidence available about the influences on student behaviour, which can overlap and interact. Behaviour influences include, among other things:
- individual factors like temperament, developmental stage, emotional regulation skills, communication skills, and disability
- family factors such as home environment, family dynamics and parenting, family stress, and mental health of family members
- peer relationships and social dynamics
- trauma and adverse events
- community factors, like safety and availability of support services
- cultural factors, including norms around behaviour and ways to respond to behaviour, and discrimination.
In this evaluation report, our main focus is on how challenging behaviours present within the classroom – rather than the ‘causes’ of those behaviours.
The companion good practice report talks about the importance of knowing and understanding students’ contexts as one of the elements of effective behaviour management.
2) How teachers in Aotearoa New Zealand approach classroom behaviours
Managing behaviour in Aotearoa New Zealand schools begins with school leadership (in collaboration with the school community) setting the culture, values, and behavioural expectations for a school and its students. In many schools this is communicated through documents that describe the expectations, procedures, and methods for implementation. Many also use visual guides to remind all staff, students, parents and whānau, and the wider community of the expectations and policies. These policies are often unique to each school, reflecting the values of the community and school context, but also drawing on the national expectations and legislation set out by the Ministry of Education.
At the classroom level, teachers encourage appropriate behaviour through a range of techniques, such as setting up the classroom effectively with teachers:
- reinforcing expectations and values through explicit teaching and discussion so students are reminded of the behavioural expectations of their school
- taking consideration when designing the physical layout of the classroom, including desk or seating arrangements
- displaying behavioural expectations, values of the school, and other informational materials such as posters showing how to regulate emotions.
Teachers need to be skilled in strategies for response, de-escalation, and general behaviour management. This includes understanding influences on behaviour, and how classroom behaviour functions as a form of communication and interaction between teachers and students. The teacher plays an important role in setting students up for success. High-quality and effective preventative measures can help reduce the time teachers spend responding to behaviour.
When behaviours begin to escalate beyond what the teacher can manage in the classroom, schools explore a range of options. These responses are tailored to the specific student, and often planned by designated school staff or the principal. These responses include things like behaviour management plans, adapting systems and environments, parent and whānau meetings, or counselling.
Alongside expectations sit procedures that guide how behaviour is managed. This may be prescriptive on how each behaviour is responded to and by whom, although this varies by school. Over two-fifths of Aotearoa New Zealand schools use Positive Behaviour for Learning Schoolwide (PB4L), which is a framework for schools to design their behavioural support system and approaches to behaviour from low-level to chronic and severe challenging behaviour, allowing a clear escalation framework. It is based on the Schoolwide Positive Behaviour Support framework from the United States.(5) PB4L is just one of the behavioural initiatives employed by schools in Aotearoa New Zealand and is funded by Ministry of Education. It includes Incredible Years, Mana Tikitiki, Huakina Mai, Check and Connect, and SchoolWide (other commonly used systems can be seen in our good practice report).
3) Stand-downs, suspensions, exclusions, and expulsions
When behaviours become more serious, through consistency, severity, or level of harm, schools and leaders may decide to remove the student from the school. Stand‑downs, suspensions, and exclusions are used by schools as a last resort.(6) Principals stand down or suspend students if they believe the student’s gross misconduct or continual disobedience is a harmful or dangerous example to other students, or if it is likely that the student themselves, or other students at the school will be seriously harmed if the student remains at school. For suspensions, the school board must hold a suspension meeting within seven school days, where they decide how to proceed.(7)
Following the suspension meeting, if the suspension is lifted, the child returns to school the next day. A decision may be made that the child return to school without conditions, or with conditions designed to facilitate the return of the student to school and relate to the behaviour or cause of behaviour that led to the suspension. This may include guidance and counselling, such as drug and alcohol counselling or anger management counselling.
Exclusions (students under 16) and expulsions (students over 16) are the formal removal of students from school. The decision to exclude or expel a student is made by the school board during a student’s suspension, at a suspension meeting. The board can decide to lift the suspension (often with conditions such as a behaviour management course), extend the suspension, or exclude/expel the student. When a child under 16 is excluded, their principal has to arrange their enrolment in another school. For expulsions, the student does not need to find another school and if they wish to do so, this is left up to the parents. Students will often leave the school system upon expulsion. Exclusions and expulsions should only occur at the extreme end of behaviour when all other options have been reasonably considered.(8)
Table 2: Table summarising stand-downs, suspensions, exclusions, and expulsions
|
Intervention |
What is it? |
When/why |
How/what is the process |
Next steps |
|
Stand-down |
Student is removed from school for a short period – no more than five days in a school term or a total of 10 days in a school year. |
Can only be used for: · continual disobedience which is harmful or dangerous · gross misconduct (e.g., serious challenging behaviour which is harmful or dangerous) · potential to cause serious harm to themselves or others. |
Only a principal or acting principal can do this. Takes effect the day after the principal’s decision is made, the student may be made to leave on the same day. |
The student can return to school or kura on the date decided by the principal.
|
|
Suspension |
The formal removal of a student from school or kura by the principal, until the school board meets to decide what to do. |
The principal must determine whether a suspension is warranted on any of the grounds above. The personal circumstances of the child, and in which the incident or behaviour happened are also considered. |
Suspension meeting with the board, principal, and parents - an independent review of the principal’s decision. The principal is not involved in the decision but may attend. |
The board can decide to: - lift the suspension without conditions - lift the suspension with conditions - extend the suspension - exclude the child if under 16 - expel the child if over 16. |
|
Exclusion |
The formal removal of a student from school or kura if they are under 16 years. They must enrol in another school or kura. |
Same reasons as suspension but generally more severe. |
This is one outcome of a suspension meeting. |
The principal has 10 school days to try to arrange for the student to attend another school or kura. If they can’t do this, they must inform MoE who will then help. |
|
Expulsion |
The formal, permanent removal of a student from school or kura if they are 16 years old or older. |
Same reasons as suspension but generally more sever to result in expulsion. |
This is one outcome of a suspension meeting. |
The principal does not have to try to find another school or kura for the student but will inform MoE if the student wants to continue with their schooling. |
Chapter 2: Challenging behaviours in classrooms
Teachers, principals, and students face a wide range of challenging behaviours in their classrooms extremely frequently. Behaviours such as talking inappropriately are the most common, but even the most concerning behaviour (physically harming others) is seen every day by one in five teachers and principals. Time spent responding and managing behaviour takes away from time spent teaching and learning, impacting all students in the class.
This section sets out the types of challenging behaviours teachers face in the classroom and how often they happen.
Teachers and students face many different behaviours that are challenging in their classrooms, such as disruptions and a lack of student engagement. These behaviours directly impact teachers’ ability to teach, and all students’ progress and enjoyment of learning.
To understand what sorts of behaviour occur in classrooms in Aotearoa New Zealand and how often, we looked at:
- Ministry of Education statistics on the frequency of stand-downs, suspensions, exclusions, and expulsions(9)
- our surveys of teachers and principals
- our interviews with teachers, leaders, parents and whānau
- PISA data over the last decade.
This chapter sets out:
- how Aotearoa New Zealand compares to other countries
- what the challenging behaviours teachers and students face in the classroom are, and how often they are happening
- how classroom behaviour looks across different schools.
What we found: An overview
Teachers experience challenging behaviour in the classroom every day, most commonly dealing with students who talk inappropriately in class or distract others. Talking inappropriately in class is the most common form of challenging behaviour seen in the classroom, with over half of teachers (52 percent) dealing with this every lesson or hour. Next most common are distracting others (51 percent seeing every hour) and refusing to follow instructions (40 percent seeing every hour).
One in three teachers see behaviours that involve damaging or taking property every day and one in five see physically harming behaviours every day. One-third of teachers (32 percent) and a quarter of principals (23 percent) experience students damaging or taking property every day. One in five teachers (21 percent) and one in four principals (26 percent) see physically harming behaviours every day.
Challenging behaviours occur at a higher rate in Aotearoa New Zealand than other countries. In 2022, NZ had the worst behavioural climate in maths classes in the OECD. The most common behaviours reported were students being distracted by digital resources (46 percent report this happening in most or every lesson) and noise and disorder (43 percent).(10)
Behaviour is more of a problem at larger schools. Teachers at larger schools see challenging classroom behaviour more often than teachers at smaller schools. Eighty-three percent of teachers at large schools see behaviours that distract from learning at least every day compared to 72 percent of teachers at small schools.
1) How does Aotearoa New Zealand compare to other countries?
PISA results over the last 20 years show that Aotearoa New Zealand has consistently had a worse behaviour climate compared to most other OECD countries.
PISA 2000 showed that Aotearoa New Zealand 15-years-olds were sitting below the OECD average for school disciplinary climate and student related behaviours.(11) In addition, when the responses from Aotearoa New Zealand students were compared with other countries, Aotearoa New Zealand students generally reported that disruptive student behaviour hindered learning in their class to a greater extent.(12)
PISA 2003 also had a similar finding that both principals and students in Aotearoa New Zealand felt that the learning climate and discipline were worse in Aotearoa New Zealand than the average expressed across the OECD.(13)
PISA 2009 again found something similar. Around one-third of Aotearoa New Zealand’s 15-year-olds reported that there were disciplinary issues in English classes in relation noise and disorder, teachers having to wait a long time for students to settle down, and students not listening to what teachers say(14). Overall, Aotearoa New Zealand 15-year-olds were more likely than the OECD average to report that there were disciplinary issues in their English classes.(15)
Figure 1: Mean index of disciplinary climate in English classes across some PISA countries 2009
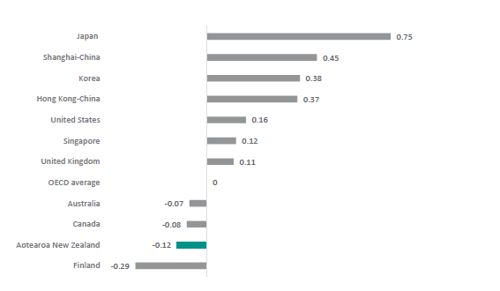
PISA 2012 continued this trend. Aotearoa New Zealand students reported more disruptive behaviour in their maths lessons than students in Australia, Canada, the United Kingdom, and Singapore in 2012.(16)
Figure 2: Mean index disciplinary climate score in maths lessons in 2012
PISA 2018 found the same results, with Aotearoa New Zealand sitting below the OECD average for behavioural climate, falling among the bottom quarter (twelfth from the bottom) of PISA countries for frequent behavioural issues in English classes. Relative to other countries, in Aotearoa New Zealand noise and disorder in classrooms is an especially common issue.(17)
Behaviour in Aotearoa New Zealand is still currently more problematic compared to other countries.
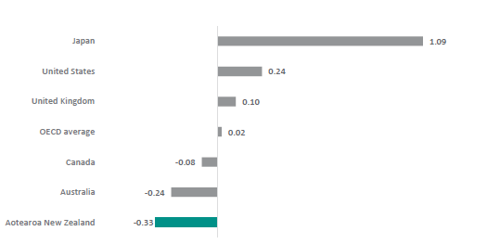
PISA 2022 found Aotearoa New Zealand scores the lowest out of all the OECD countries on the behavioural climate in maths classes, fourth from the bottom compared to all PISA countries.(18)
The most common behaviours reported were students being distracted by digital resources (for example smartphones, websites, and apps - 46 percent report this happening in most or every lesson) and noise and disorder (43 percent).
Compared to the OECD average, there was a greater proportion of students in Aotearoa New Zealand reporting all behaviours occurring in every or most maths lessons.
Figure 3: Proportion of students reporting ‘every lesson’ or ‘most lessons’ in maths classes 2022
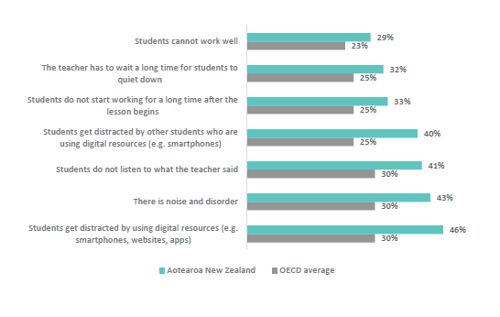
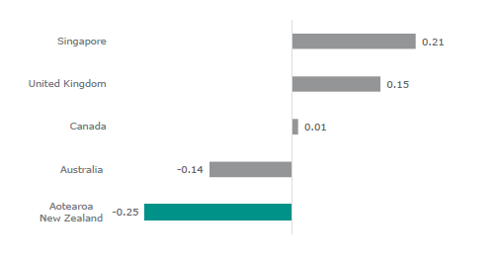
Figure 4: Index of disciplinary climate in maths class across some OECD countries 2022 (higher numbers are better disciplinary climate, lower numbers are worse disciplinary climates)
2) What are the challenging behaviours teachers face in the classroom, and how often are they happening?
This section sets out what we know about how often students are engaging in five different types of behaviour:
- talking inappropriately in class
- distracting others
- refusing to follow instructions
- damaging or taking property
- physically harming others
- stand-downs, suspension, exclusions, and expulsions.
We asked teachers and principals how often they deal with these challenging behaviours. These five behaviours are set out in greater detail below.
We also looked at how many students are stood down, suspended, excluded, or expelled, and why.
The next sections share what we found about the frequency of each of these sets of challenging behaviours. Many of the behaviours overlap as the behaviours do not occur in isolation. For example, a student talking inappropriately in class may also be doing so in a way that distracts others.
a) Talking inappropriately in class
Taking inappropriately in class can take different forms in the classroom, such as calling out, shouting, and unauthorised talking to other students.
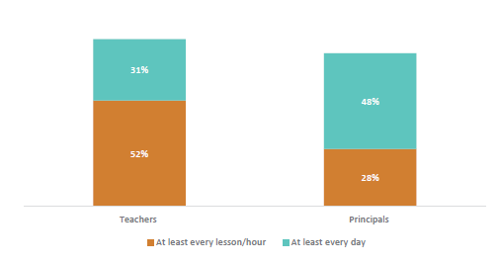
The most common behaviour teachers face is students talking inappropriately in class, with over three-quarters of teachers and principals seeing this every day.
Four out of five teachers (83 percent) and three out of four principals (76 percent) see this behaviour at least every day. In addition to this, half of teachers (52 percent) and over a quarter of principals (28 percent) see this as often as every lesson/hour.
Figure 5: Frequency that talking inappropriately in class is seen by teachers and principals
In focus groups with teachers, students, and parents, we heard many examples of students talking inappropriately in class. Some things we heard about were high levels of students using disrespectful language and being rude to school staff, calling out across the classroom and over other students, and being rude to other students including swearing.
“In my classroom, it's probably my more challenging ones… [who] need to be centre of attention... [It’s] like an impulse control issue... Talking over you. Talking over each other.” (Teacher)
b) Distracting others
Behaviours that distract from learning take a range of forms in the classroom, including unauthorised use of phone/devices, attempting to distract others, and pulling faces.
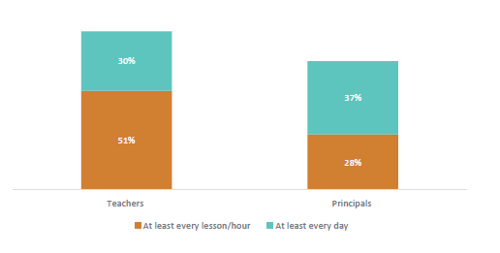
Behaviours that distract students from their learning is the second most common behaviour, with over four in five teachers and two-thirds of principals experiencing this every day.
Four out of five teachers (81 percent) and two out of three principals (65 percent) see this behaviour every day. Half of teachers (51 percent) and just over a quarter of principals (28 percent) see this behaviour every lesson/hour.
Figure 6: Frequency that distracting behaviours in class is seen by teachers and principals
In focus groups with teachers, students, and parents, we heard examples of behaviours that distract themselves and others. Some of these examples included being disengaged from work and not being ready for tasks, an increase in students using devices at inappropriate times, an increase in the number of students feeling fatigued and unable to concentrate for long periods, and talking to their friends instead of working.
“Disrupting the learning of others… includes a whole range of things from being off task, falling out, chatting with somebody else near where you are or down the classroom, it could be throwing things. There's a whole variety that fits under that.” (Deputy principal)
“The classroom sizes are quite large and so you do have one or two [students] that can be disruptive to the class and take away from their learning. But I also know that my child also can lose focus and she can be quite disruptive as well.” (Parent)
c) Refusing to follow instructions
Behaviours that involve refusal to follow instructions include students being off task, ignoring requests, and unauthorised moving around the room.
The third most common behaviour that teachers face is students refusing to follow instructions, with just under three-quarters of teachers and two-thirds of principals seeing this behaviour every day.
Three out of four teachers (73 percent) and two out of three principals (65 percent) experience students refusing to follow instructions every day. In addition to this, 40 percent of teachers and a quarter of principals (24 percent) see this behaviour every lesson/hour.
In focus groups with staff, students, and parents, we heard that this often involves students being off task, ignoring or verbally defying the teacher, and even leaving the classroom.
“Refusing to do… what they're told…. defiance… when you ask them to do something, they'll say ‘no’.” (Teacher)
“So one of the things we are noticing a lot with our kids entering in, is an inability to complete tasks and to follow simple instructions. We have a lot of our younger children and some of our older kids as well that opt out [of learning], and can opt out in a very disruptive manner… Refusal in varying ways. For the older children that I'm thinking about, it's often verbal, like, ‘No, I'm not doing it’. For things like our little ones, it will be removing themselves, running off out of the classroom, hiding in spaces, hiding under tables.” (Teacher)
d) Damaging or taking property
Behaviours that involve damaging or taking property include intentionally breaking classroom items, taking other people’s items without consent, and using classroom items without permission.
Damaging or taking others’ property is seen by a third of teachers and a quarter of principals every day.
A third of teachers (32 percent) and a quarter of principals (23 percent) experience students damaging or taking property every day, and one in 10 teachers (8 percent) and 4 percent of principals see this every lesson/hour.
In focus groups with teachers, students, and parents, we heard examples of behaviours that involve damaging or taking property. Teachers raised concerns about students throwing objects in class, such as chairs and kicking tables. Parents sometimes attribute these behaviours to a student’s lack of impulse control.
“My daughter tells me there's a student that goes in there and he will get aggressive, pick up desks and chairs and throw them… that disrupts their afternoon, their learning for the day because they're all talking about that rather than focusing on the actual learning.” (Parent)
e) Physically harming others
Behaviours that involve physically harming others include things such as hitting, kicking, punching, or biting others.
Students that physically harm others is the most extreme behaviour and one in five teachers and a quarter of principals experiencing this every day.
One in five teachers (21 percent) and one in four principals (26 percent) see this every day, while 2 percent of teachers and principals deal with this behaviour every lesson/hour.
In focus groups with teachers, students, and parents, we heard that these behaviours are extremely challenging and involve aggression, physical and extreme violence, and fighting with other students.
“We've had children come in [to school] with extreme violence with no empathy.” (Principal)
f) Stand-downs, suspensions, exclusions, and expulsions
There is variation in how schools choose to use these interventions, and they are not universally or consistently applied.(19) Because of this, these interventions are not a direct measure of extreme behaviour but are an indication of how often schools face student behaviour that is extremely challenging.
The following data comes from the Ministry of Education database on stand-downs, suspensions, exclusions, and expulsions.(20)
Stand-downs
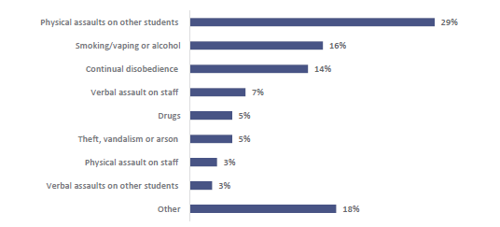
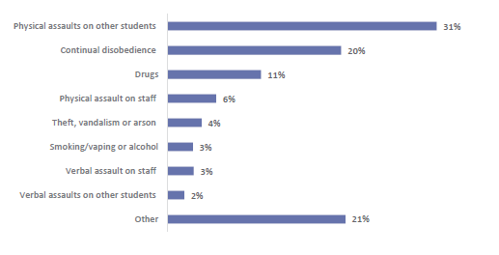
In 2022 there were 32.6 stand-downs per 1,000 students. The reasons for stand-downs are recorded by schools and are broken down by behaviour reason categories here:
- physical assaults on other students (9.6 stand-downs per 1000 students)
- smoking/vaping or alcohol (5.2 stand-downs per 1000 students)
- continual disobedience (4.6 stand-downs per 1000 students)
- verbal assault on staff (2.2 stand-downs per 1000 students)
- drugs (including substance abuse) (1.7 stand-downs per 1000 students)
- theft, vandalism, or arson (1.7 stand-downs per 1000 students)
- physical assault on staff (1.1 stand-downs per 1000 students)
- verbal assaults on other students (0.9 stand-downs per 1000 students)
- other which includes sexual harassment, sexual misconduct, weapons, and other harmful or dangerous behaviour (5.7 stand-downs per 1000 students).
Figure 7: Percentage of students stood-down in 2022 by behaviour category
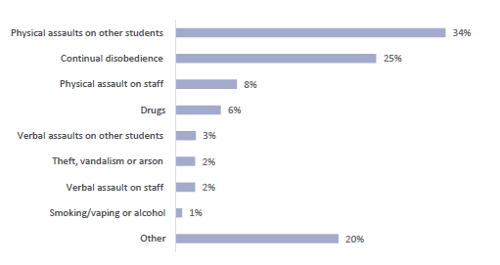
Suspensions
In 2022, there were 3.5 suspensions per 1,000 students. The reasons for suspensions are recorded by schools and are broken down by behaviour reason categories here:
- physical assaults on other students (1.1 suspensions per 1,000 students)
- drugs (0.4 suspensions per 1,000 students)
- continual disobedience (0.7 suspensions per 1,000 students)
- physical assault on staff (0.2 suspensions per 1,000 students)
- verbal assaults on other students (0.1 suspensions per 1,000 students)
- theft, vandalism, or arson (0.1 suspensions per 1,000 students)
- verbal assault on staff (0.1 suspensions per 1,000 students)
- smoking/vaping or alcohol (0.1 suspensions per 1,000 students)
- other (0.7 suspensions per 1,000 students).
Figure 8: Percentage of students suspended in 2022 by behaviour category
Exclusions
In 2022, there were 1.3 exclusions per 1,000 students. The reasons for exclusions are recorded by schools and are broken down by behaviour reason categories here:
- physical assaults on other students (0.4 exclusions per 1,000 students)
- continual disobedience (0.3 exclusions per 1,000 students)
- physical assault on staff (0.1 exclusions per 1,000 students)
- drugs (0.1 exclusions per 1,000 students)
- verbal assaults on other students (<0.1 exclusions per 1,000 students)
- theft, vandalism, or arson (<0.1 exclusions per 1,000 students)
- verbal assault on staff (<0.1 exclusions per 1,000 students)
- smoking/vaping or alcohol (<0.1 exclusions per 1,000 students)
- other (0.3 exclusions per 1,000 students).
Figure 9: Percentage of students excluded in 2022 by behaviour category
3) How is classroom behaviour different across schools?
There are differences in the types and frequency that behaviours occur across different school contexts, with physical behaviours most common at primary, distraction most common at secondary, and greater behavioural problems at large schools and schools in low socioeconomic communities. Teachers with less experience also see challenging behaviours more frequently.
This section sets out what we know about the differences in behaviours occurring across:
- school age groups
- school size
- schools in high and low socioeconomic communities
- teachers’ experience.
a) School age groups
Physically harming behaviours are more common at primary schools.
Twice as many teachers see physically harming behaviours every day or more at primary school (29 percent) compared to secondary (15 percent), while intermediate schools sit in between (21 percent).
Behaviours that distract from learning are more frequent at secondary schools.
The most common challenging classroom behaviour seen by secondary school teachers are behaviours that distract from learning. Eighty-six percent of secondary teachers, 73 percent of primary, and 81 percent of intermediate teachers see behaviours that distract from learning every day or more. Further, teachers at secondary schools are 1.5 times more likely to see behaviours that distract from learning every hour (58 percent) than teachers at primary (40 percent) or intermediate schools (41 percent).
Behaviours, including behaviour problems, change with students’ age.(21) Physical behaviour is presenting more often in younger students as they are still developing the self-regulation required to control physical displays of behaviour. As they get older, problem behaviours are more likely to present as distracting behaviours.
Figure 10: Percent of teachers seeing behaviours every day or more across school age group
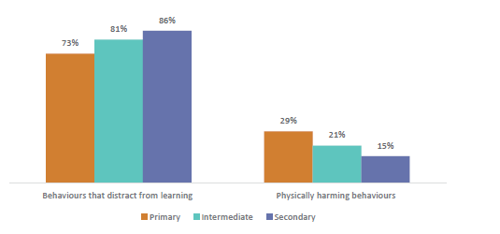
b) School size
Behaviour is more of a problem at larger schools.
Teachers at larger schools see challenging classroom behaviours more often than teachers in smaller schools. Talking inappropriately in class is seen every day at 83 percent of large schools compared to 77 percent of small schools, as is refusal to follow instructions (75 percent compared to 65 percent), and behaviours that distract from learning (83 percent compared to 72 percent).
Figure 11: Percent of teachers seeing behaviours every day or more across school size
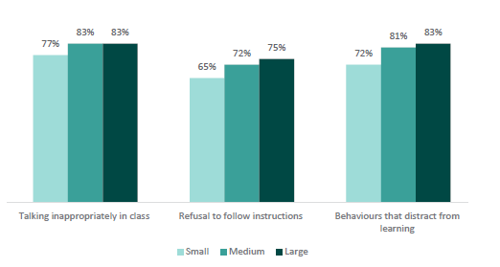
The nature of small schools may be a driving factor behind this finding. In smaller schools there can be greater opportunities for students’ learning to be tailored, greater ability for student inclusion, and it is easier to build relationships with students, parents and whānau, and the community.(22) These are all key aspects of effective behaviour management.
|
New York school size reform The New York City public school system is the largest in the United States and, for the last decade, high schools have undergone substantial reform. Beginning in 2002, the New York City Department of Education closed many large, comprehensive high schools with a history of low performance and created hundreds of new small secondary schools.(23) The new, smaller schools were an attempt to create more effective and more supportive environments, with strong student-faculty relationships, high academic expectations, personalized learning environments, and partnerships with external organizations.(24) Research has shown the positive impact that this has had markedly and consistently increasing high school graduation rates (by 9.5 percentage points overall, and for many different student subgroups) for a large population of educationally and economically disadvantaged students of colour without increasing annual school operating costs.(25) |
c) Schools in high and low socioeconomic communities
Behaviour is more of a problem at schools in low socioeconomic communities.
Teachers and principals at schools in low socioeconomic communities see challenging behaviour more frequently in all behaviour categories except verbal disruption.
For example, 40 percent teachers from schools in low socioeconomic communities see behaviours that relate to property every day, whereas only 23 percent of those in schools high socioeconomic communities see it every day.
Figure 12: Behaviours seen at least every day by teachers in schools in high and low socioeconomic communities
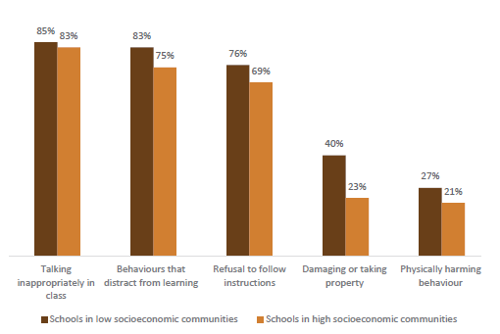
Children from low socioeconomic backgrounds face a greater number of challenges in their families, whānau, and community, and are more likely to have experienced trauma and adversity.(26) Our finding reflects what other research has found, which is that these students tend to display greater levels of challenging behaviours than those from high socioeconomic backgrounds.(27)
d) Teachers’ experience
Teachers with less experience report experiencing all behaviours more frequently.
For example, 83 percent of teachers with five years or less experience see refusal behaviours every day, compared with 80 percent of those with six to nine years’ experience and 68 percent of those with 10 plus years’ experience.
Figure 13: Behaviours seen at least every day by teachers with varying levels of experience
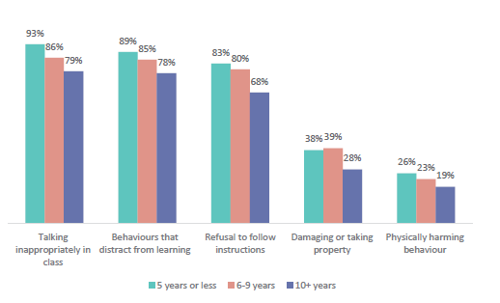
We found that following initial teacher education, under half (45 percent) of new teachers report being capable in managing classroom behaviours, and that they have to learn this on the job(28). As teachers with greater experience are better at preventative measures for challenging behaviour, it is likely this that drives new teachers to face more challenging behaviours.
Conclusion
Teachers and students encounter a wide range of challenging behaviours every day in the classroom, with physical harm more common in primary schools, and distracting behaviours the most common in secondary schools. Other commonly seen challenging behaviours at schools are refusal to follow instructions, damaging or taking property, and physically harming others.
Teachers at large schools face challenging behaviours more often than teachers in small schools. Schools in low socioeconomic communities experience challenging behaviours more frequently across most behavioural categories.
There is clearly a large behavioural issue in our school classrooms. When we compare to other countries in the OECD, Aotearoa New Zealand consistently falls below the average for behavioural climate, most recently in the 2022 PISA findings for maths classrooms but extending back to 2018 and earlier.
Teachers, principals, and students face a wide range of challenging behaviours in their classrooms extremely frequently. Behaviours such as talking inappropriately are the most common, but even the most concerning behaviour (physically harming others) is seen every day by one in five teachers and principals. Time spent responding and managing behaviour takes away from time spent teaching and learning, impacting all students in the class.
This section sets out the types of challenging behaviours teachers face in the classroom and how often they happen.
Teachers and students face many different behaviours that are challenging in their classrooms, such as disruptions and a lack of student engagement. These behaviours directly impact teachers’ ability to teach, and all students’ progress and enjoyment of learning.
To understand what sorts of behaviour occur in classrooms in Aotearoa New Zealand and how often, we looked at:
- Ministry of Education statistics on the frequency of stand-downs, suspensions, exclusions, and expulsions(9)
- our surveys of teachers and principals
- our interviews with teachers, leaders, parents and whānau
- PISA data over the last decade.
This chapter sets out:
- how Aotearoa New Zealand compares to other countries
- what the challenging behaviours teachers and students face in the classroom are, and how often they are happening
- how classroom behaviour looks across different schools.
What we found: An overview
Teachers experience challenging behaviour in the classroom every day, most commonly dealing with students who talk inappropriately in class or distract others. Talking inappropriately in class is the most common form of challenging behaviour seen in the classroom, with over half of teachers (52 percent) dealing with this every lesson or hour. Next most common are distracting others (51 percent seeing every hour) and refusing to follow instructions (40 percent seeing every hour).
One in three teachers see behaviours that involve damaging or taking property every day and one in five see physically harming behaviours every day. One-third of teachers (32 percent) and a quarter of principals (23 percent) experience students damaging or taking property every day. One in five teachers (21 percent) and one in four principals (26 percent) see physically harming behaviours every day.
Challenging behaviours occur at a higher rate in Aotearoa New Zealand than other countries. In 2022, NZ had the worst behavioural climate in maths classes in the OECD. The most common behaviours reported were students being distracted by digital resources (46 percent report this happening in most or every lesson) and noise and disorder (43 percent).(10)
Behaviour is more of a problem at larger schools. Teachers at larger schools see challenging classroom behaviour more often than teachers at smaller schools. Eighty-three percent of teachers at large schools see behaviours that distract from learning at least every day compared to 72 percent of teachers at small schools.
1) How does Aotearoa New Zealand compare to other countries?
PISA results over the last 20 years show that Aotearoa New Zealand has consistently had a worse behaviour climate compared to most other OECD countries.
PISA 2000 showed that Aotearoa New Zealand 15-years-olds were sitting below the OECD average for school disciplinary climate and student related behaviours.(11) In addition, when the responses from Aotearoa New Zealand students were compared with other countries, Aotearoa New Zealand students generally reported that disruptive student behaviour hindered learning in their class to a greater extent.(12)
PISA 2003 also had a similar finding that both principals and students in Aotearoa New Zealand felt that the learning climate and discipline were worse in Aotearoa New Zealand than the average expressed across the OECD.(13)
PISA 2009 again found something similar. Around one-third of Aotearoa New Zealand’s 15-year-olds reported that there were disciplinary issues in English classes in relation noise and disorder, teachers having to wait a long time for students to settle down, and students not listening to what teachers say(14). Overall, Aotearoa New Zealand 15-year-olds were more likely than the OECD average to report that there were disciplinary issues in their English classes.(15)
Figure 1: Mean index of disciplinary climate in English classes across some PISA countries 2009
PISA 2012 continued this trend. Aotearoa New Zealand students reported more disruptive behaviour in their maths lessons than students in Australia, Canada, the United Kingdom, and Singapore in 2012.(16)
Figure 2: Mean index disciplinary climate score in maths lessons in 2012
PISA 2018 found the same results, with Aotearoa New Zealand sitting below the OECD average for behavioural climate, falling among the bottom quarter (twelfth from the bottom) of PISA countries for frequent behavioural issues in English classes. Relative to other countries, in Aotearoa New Zealand noise and disorder in classrooms is an especially common issue.(17)
Behaviour in Aotearoa New Zealand is still currently more problematic compared to other countries.
PISA 2022 found Aotearoa New Zealand scores the lowest out of all the OECD countries on the behavioural climate in maths classes, fourth from the bottom compared to all PISA countries.(18)
The most common behaviours reported were students being distracted by digital resources (for example smartphones, websites, and apps - 46 percent report this happening in most or every lesson) and noise and disorder (43 percent).
Compared to the OECD average, there was a greater proportion of students in Aotearoa New Zealand reporting all behaviours occurring in every or most maths lessons.
Figure 3: Proportion of students reporting ‘every lesson’ or ‘most lessons’ in maths classes 2022
Figure 4: Index of disciplinary climate in maths class across some OECD countries 2022 (higher numbers are better disciplinary climate, lower numbers are worse disciplinary climates)
2) What are the challenging behaviours teachers face in the classroom, and how often are they happening?
This section sets out what we know about how often students are engaging in five different types of behaviour:
- talking inappropriately in class
- distracting others
- refusing to follow instructions
- damaging or taking property
- physically harming others
- stand-downs, suspension, exclusions, and expulsions.
We asked teachers and principals how often they deal with these challenging behaviours. These five behaviours are set out in greater detail below.
We also looked at how many students are stood down, suspended, excluded, or expelled, and why.
The next sections share what we found about the frequency of each of these sets of challenging behaviours. Many of the behaviours overlap as the behaviours do not occur in isolation. For example, a student talking inappropriately in class may also be doing so in a way that distracts others.
a) Talking inappropriately in class
Taking inappropriately in class can take different forms in the classroom, such as calling out, shouting, and unauthorised talking to other students.
The most common behaviour teachers face is students talking inappropriately in class, with over three-quarters of teachers and principals seeing this every day.
Four out of five teachers (83 percent) and three out of four principals (76 percent) see this behaviour at least every day. In addition to this, half of teachers (52 percent) and over a quarter of principals (28 percent) see this as often as every lesson/hour.
Figure 5: Frequency that talking inappropriately in class is seen by teachers and principals
In focus groups with teachers, students, and parents, we heard many examples of students talking inappropriately in class. Some things we heard about were high levels of students using disrespectful language and being rude to school staff, calling out across the classroom and over other students, and being rude to other students including swearing.
“In my classroom, it's probably my more challenging ones… [who] need to be centre of attention... [It’s] like an impulse control issue... Talking over you. Talking over each other.” (Teacher)
b) Distracting others
Behaviours that distract from learning take a range of forms in the classroom, including unauthorised use of phone/devices, attempting to distract others, and pulling faces.
Behaviours that distract students from their learning is the second most common behaviour, with over four in five teachers and two-thirds of principals experiencing this every day.
Four out of five teachers (81 percent) and two out of three principals (65 percent) see this behaviour every day. Half of teachers (51 percent) and just over a quarter of principals (28 percent) see this behaviour every lesson/hour.
Figure 6: Frequency that distracting behaviours in class is seen by teachers and principals
In focus groups with teachers, students, and parents, we heard examples of behaviours that distract themselves and others. Some of these examples included being disengaged from work and not being ready for tasks, an increase in students using devices at inappropriate times, an increase in the number of students feeling fatigued and unable to concentrate for long periods, and talking to their friends instead of working.
“Disrupting the learning of others… includes a whole range of things from being off task, falling out, chatting with somebody else near where you are or down the classroom, it could be throwing things. There's a whole variety that fits under that.” (Deputy principal)
“The classroom sizes are quite large and so you do have one or two [students] that can be disruptive to the class and take away from their learning. But I also know that my child also can lose focus and she can be quite disruptive as well.” (Parent)
c) Refusing to follow instructions
Behaviours that involve refusal to follow instructions include students being off task, ignoring requests, and unauthorised moving around the room.
The third most common behaviour that teachers face is students refusing to follow instructions, with just under three-quarters of teachers and two-thirds of principals seeing this behaviour every day.
Three out of four teachers (73 percent) and two out of three principals (65 percent) experience students refusing to follow instructions every day. In addition to this, 40 percent of teachers and a quarter of principals (24 percent) see this behaviour every lesson/hour.
In focus groups with staff, students, and parents, we heard that this often involves students being off task, ignoring or verbally defying the teacher, and even leaving the classroom.
“Refusing to do… what they're told…. defiance… when you ask them to do something, they'll say ‘no’.” (Teacher)
“So one of the things we are noticing a lot with our kids entering in, is an inability to complete tasks and to follow simple instructions. We have a lot of our younger children and some of our older kids as well that opt out [of learning], and can opt out in a very disruptive manner… Refusal in varying ways. For the older children that I'm thinking about, it's often verbal, like, ‘No, I'm not doing it’. For things like our little ones, it will be removing themselves, running off out of the classroom, hiding in spaces, hiding under tables.” (Teacher)
d) Damaging or taking property
Behaviours that involve damaging or taking property include intentionally breaking classroom items, taking other people’s items without consent, and using classroom items without permission.
Damaging or taking others’ property is seen by a third of teachers and a quarter of principals every day.
A third of teachers (32 percent) and a quarter of principals (23 percent) experience students damaging or taking property every day, and one in 10 teachers (8 percent) and 4 percent of principals see this every lesson/hour.
In focus groups with teachers, students, and parents, we heard examples of behaviours that involve damaging or taking property. Teachers raised concerns about students throwing objects in class, such as chairs and kicking tables. Parents sometimes attribute these behaviours to a student’s lack of impulse control.
“My daughter tells me there's a student that goes in there and he will get aggressive, pick up desks and chairs and throw them… that disrupts their afternoon, their learning for the day because they're all talking about that rather than focusing on the actual learning.” (Parent)
e) Physically harming others
Behaviours that involve physically harming others include things such as hitting, kicking, punching, or biting others.
Students that physically harm others is the most extreme behaviour and one in five teachers and a quarter of principals experiencing this every day.
One in five teachers (21 percent) and one in four principals (26 percent) see this every day, while 2 percent of teachers and principals deal with this behaviour every lesson/hour.
In focus groups with teachers, students, and parents, we heard that these behaviours are extremely challenging and involve aggression, physical and extreme violence, and fighting with other students.
“We've had children come in [to school] with extreme violence with no empathy.” (Principal)
f) Stand-downs, suspensions, exclusions, and expulsions
There is variation in how schools choose to use these interventions, and they are not universally or consistently applied.(19) Because of this, these interventions are not a direct measure of extreme behaviour but are an indication of how often schools face student behaviour that is extremely challenging.
The following data comes from the Ministry of Education database on stand-downs, suspensions, exclusions, and expulsions.(20)
Stand-downs
In 2022 there were 32.6 stand-downs per 1,000 students. The reasons for stand-downs are recorded by schools and are broken down by behaviour reason categories here:
- physical assaults on other students (9.6 stand-downs per 1000 students)
- smoking/vaping or alcohol (5.2 stand-downs per 1000 students)
- continual disobedience (4.6 stand-downs per 1000 students)
- verbal assault on staff (2.2 stand-downs per 1000 students)
- drugs (including substance abuse) (1.7 stand-downs per 1000 students)
- theft, vandalism, or arson (1.7 stand-downs per 1000 students)
- physical assault on staff (1.1 stand-downs per 1000 students)
- verbal assaults on other students (0.9 stand-downs per 1000 students)
- other which includes sexual harassment, sexual misconduct, weapons, and other harmful or dangerous behaviour (5.7 stand-downs per 1000 students).
Figure 7: Percentage of students stood-down in 2022 by behaviour category
Suspensions
In 2022, there were 3.5 suspensions per 1,000 students. The reasons for suspensions are recorded by schools and are broken down by behaviour reason categories here:
- physical assaults on other students (1.1 suspensions per 1,000 students)
- drugs (0.4 suspensions per 1,000 students)
- continual disobedience (0.7 suspensions per 1,000 students)
- physical assault on staff (0.2 suspensions per 1,000 students)
- verbal assaults on other students (0.1 suspensions per 1,000 students)
- theft, vandalism, or arson (0.1 suspensions per 1,000 students)
- verbal assault on staff (0.1 suspensions per 1,000 students)
- smoking/vaping or alcohol (0.1 suspensions per 1,000 students)
- other (0.7 suspensions per 1,000 students).
Figure 8: Percentage of students suspended in 2022 by behaviour category
Exclusions
In 2022, there were 1.3 exclusions per 1,000 students. The reasons for exclusions are recorded by schools and are broken down by behaviour reason categories here:
- physical assaults on other students (0.4 exclusions per 1,000 students)
- continual disobedience (0.3 exclusions per 1,000 students)
- physical assault on staff (0.1 exclusions per 1,000 students)
- drugs (0.1 exclusions per 1,000 students)
- verbal assaults on other students (<0.1 exclusions per 1,000 students)
- theft, vandalism, or arson (<0.1 exclusions per 1,000 students)
- verbal assault on staff (<0.1 exclusions per 1,000 students)
- smoking/vaping or alcohol (<0.1 exclusions per 1,000 students)
- other (0.3 exclusions per 1,000 students).
Figure 9: Percentage of students excluded in 2022 by behaviour category
3) How is classroom behaviour different across schools?
There are differences in the types and frequency that behaviours occur across different school contexts, with physical behaviours most common at primary, distraction most common at secondary, and greater behavioural problems at large schools and schools in low socioeconomic communities. Teachers with less experience also see challenging behaviours more frequently.
This section sets out what we know about the differences in behaviours occurring across:
- school age groups
- school size
- schools in high and low socioeconomic communities
- teachers’ experience.
a) School age groups
Physically harming behaviours are more common at primary schools.
Twice as many teachers see physically harming behaviours every day or more at primary school (29 percent) compared to secondary (15 percent), while intermediate schools sit in between (21 percent).
Behaviours that distract from learning are more frequent at secondary schools.
The most common challenging classroom behaviour seen by secondary school teachers are behaviours that distract from learning. Eighty-six percent of secondary teachers, 73 percent of primary, and 81 percent of intermediate teachers see behaviours that distract from learning every day or more. Further, teachers at secondary schools are 1.5 times more likely to see behaviours that distract from learning every hour (58 percent) than teachers at primary (40 percent) or intermediate schools (41 percent).
Behaviours, including behaviour problems, change with students’ age.(21) Physical behaviour is presenting more often in younger students as they are still developing the self-regulation required to control physical displays of behaviour. As they get older, problem behaviours are more likely to present as distracting behaviours.
Figure 10: Percent of teachers seeing behaviours every day or more across school age group
b) School size
Behaviour is more of a problem at larger schools.
Teachers at larger schools see challenging classroom behaviours more often than teachers in smaller schools. Talking inappropriately in class is seen every day at 83 percent of large schools compared to 77 percent of small schools, as is refusal to follow instructions (75 percent compared to 65 percent), and behaviours that distract from learning (83 percent compared to 72 percent).
Figure 11: Percent of teachers seeing behaviours every day or more across school size
The nature of small schools may be a driving factor behind this finding. In smaller schools there can be greater opportunities for students’ learning to be tailored, greater ability for student inclusion, and it is easier to build relationships with students, parents and whānau, and the community.(22) These are all key aspects of effective behaviour management.
|
New York school size reform The New York City public school system is the largest in the United States and, for the last decade, high schools have undergone substantial reform. Beginning in 2002, the New York City Department of Education closed many large, comprehensive high schools with a history of low performance and created hundreds of new small secondary schools.(23) The new, smaller schools were an attempt to create more effective and more supportive environments, with strong student-faculty relationships, high academic expectations, personalized learning environments, and partnerships with external organizations.(24) Research has shown the positive impact that this has had markedly and consistently increasing high school graduation rates (by 9.5 percentage points overall, and for many different student subgroups) for a large population of educationally and economically disadvantaged students of colour without increasing annual school operating costs.(25) |
c) Schools in high and low socioeconomic communities
Behaviour is more of a problem at schools in low socioeconomic communities.
Teachers and principals at schools in low socioeconomic communities see challenging behaviour more frequently in all behaviour categories except verbal disruption.
For example, 40 percent teachers from schools in low socioeconomic communities see behaviours that relate to property every day, whereas only 23 percent of those in schools high socioeconomic communities see it every day.
Figure 12: Behaviours seen at least every day by teachers in schools in high and low socioeconomic communities
Children from low socioeconomic backgrounds face a greater number of challenges in their families, whānau, and community, and are more likely to have experienced trauma and adversity.(26) Our finding reflects what other research has found, which is that these students tend to display greater levels of challenging behaviours than those from high socioeconomic backgrounds.(27)
d) Teachers’ experience
Teachers with less experience report experiencing all behaviours more frequently.
For example, 83 percent of teachers with five years or less experience see refusal behaviours every day, compared with 80 percent of those with six to nine years’ experience and 68 percent of those with 10 plus years’ experience.
Figure 13: Behaviours seen at least every day by teachers with varying levels of experience
We found that following initial teacher education, under half (45 percent) of new teachers report being capable in managing classroom behaviours, and that they have to learn this on the job(28). As teachers with greater experience are better at preventative measures for challenging behaviour, it is likely this that drives new teachers to face more challenging behaviours.
Conclusion
Teachers and students encounter a wide range of challenging behaviours every day in the classroom, with physical harm more common in primary schools, and distracting behaviours the most common in secondary schools. Other commonly seen challenging behaviours at schools are refusal to follow instructions, damaging or taking property, and physically harming others.
Teachers at large schools face challenging behaviours more often than teachers in small schools. Schools in low socioeconomic communities experience challenging behaviours more frequently across most behavioural categories.
There is clearly a large behavioural issue in our school classrooms. When we compare to other countries in the OECD, Aotearoa New Zealand consistently falls below the average for behavioural climate, most recently in the 2022 PISA findings for maths classrooms but extending back to 2018 and earlier.
Chapter 3: How are classroom behaviours changing?
Student behaviour is getting worse and this has impacts for all students. Teachers observe an increase in challenging classroom behaviours, particularly through a greater number of students displaying such behaviours. Teachers attribute these changes to a range of factors such as Covid-19 impacts, changes to home-life, increased mental health challenges, and device use.
We know that challenging behaviours are occurring at a high rate in our classrooms. In addition to this, teachers are experiencing an increase in these challenging classroom behaviours in recent years. This means that students are experiencing less focused teaching and learning time in classes.
To understand how behaviour has changed, and why, we looked at:
- Ministry of Education statistics on the frequency of stand-downs
- our surveys of teachers and principals
- our interviews with teachers, leaders, parents and whānau
- PISA results.
This chapter sets out:
- how the behaviours have changed over time
- how the behaviours have changed at different schools.
What we found: An overview
Student behaviour is getting worse. Three-quarters of teachers (74 percent) and principals (70 percent) report that behaviour overall has become much worse/worse in the last two years.
Nearly all teachers who report behaviour is worse say a greater number of students are displaying challenging behaviours. Eighty-four percent of teachers who report behaviour has become much worse/worse say a greater number of students are displaying challenging behaviours.
Teachers report that refusing to follow instructions and distracting others are the behaviours that have become worse most often. Three out of four teachers report that refusing to follow instructions (74 percent) and distracting others (73 percent) have become much worse/worse in the last two years.
1) What do we know about the changes in behaviour over time?
We asked teachers and principals how behaviour has changed in the last two years (or since they started teaching if this is less than two years). Teachers and principals identify all types of classroom behaviour as getting worse.
This section sets out what we know about the changes in behaviour over time, including:
- overall behaviour
- refusing to follow instructions
- distracting others
- talking in appropriately in class
- physically harming others
- damaging or taking property
- changes to the reasons for stand-downs in Aotearoa New Zealand
- why behaviours are changing.
a) Behaviour overall
ERO has been concerned about behaviour throughout Covid-19, which we discuss in greater detail later in this chapter. In Term 2 of 2021, we found that 39 percent of principals reported that behaviour was worse or much worse than they would expect at this time of year. In Term 1 of 2023, we found that 41 percent of principals reported that behaviour was worse or much worse than they would expect at that time of year. We heard in this research that Covid-19 was one contributing factor in why behaviour is changing.
Figure 14: Teachers reporting behaviour is much worse/worse than they would expect for that time of the year across time
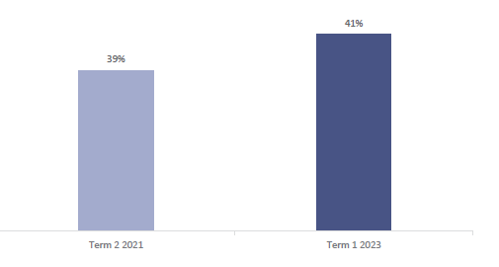
In Term 3 of 2023, we asked a similar question to look at changes in behaviour overall and different behaviour categories over the last two years. These are covered next.
Over seven in 10 teachers and principals say behaviour overall has become worse and this is most often due to a larger number of students presenting these behaviours.
The majority of teachers and principals indicate behaviour is becoming worse. Three-quarters of teachers (74 percent) and 70 percent of principals report behaviour has become worse or much worse in the last two years.
Figure 15: Teachers’ and principals’ perception of behaviour change overall in the last two years
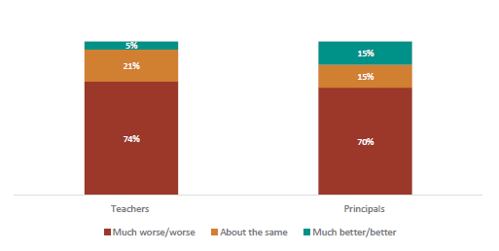
Nearly all (84 percent) teachers who feel behaviour is worse or much worse, say a greater number of students are displaying challenging behaviour. Fifty-nine percent of teachers who feel it has become worse or much worse attribute it to seeing it more often from the same students and 58 percent to the severity of the behaviours increasing.
Figure 16: Ways in which teachers report behaviour overall has become worse (out of those who report it as much worse/worse)
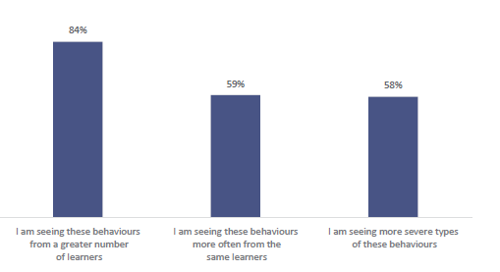
PISA 2022 results show that in the last 10 years there has been an increase in the percentage of students identifying the following negative behaviours in most or every maths lesson.
- Students are not working well in most or every lesson (4 percent point increase since 2012).
- Students do not start working for a long time after the lesson begins (2 percent point increase since 2012).
Additionally, over the past two decades (between 2000 and 2018) there has been a steady rise in the proportion of students in noisy and disorderly classrooms (from 33 percent to 42 percent) and in classrooms where students don’t listen to the teacher (from 24 percent to 35 percent).(29)
Figure 17: Students not listening to the teacher and noise and disorder from 2000 to 2018
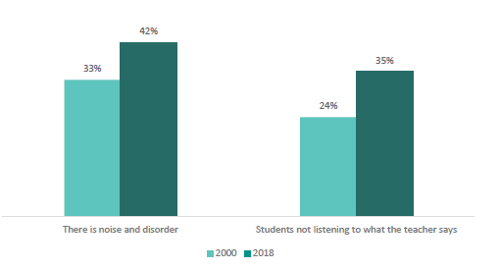
In focus groups we heard one of the key changes to behaviour is the increase in complex needs in the classroom, such as younger children entering school with very low levels of oral language and an increase in anxiety (from both students and their parents).
“We find that issues are more multi-layered and complex in nature, and there's always a reason for behaviour. And when we dig into those reasons for behaviour, we find that there's a lot going on in children’s lives and… in families’ lives and in teachers’ lives. So our lives feel more complex.” (Student support director)
In focus groups we also heard about students not learning from previous behaviour corrections and repeating the same behaviours.
“For me speaking to children that might get sent out of the classroom, it's like they understand what they've done wrong and you're able to talk through it, but it doesn't mean they're going to learn from it and not do it again. So that's the continuous cycle of repeating the behaviour or behaviours and not actually like taking on board what they said, then sort of making the change themselves as a person, changing their own behaviour. It's a lot of repetition of it.” (Principal)
Teachers identify these areas as having become worse the most frequently (in order):
- refusing to follow instructions
- distracting others
- talking in appropriately in class
- physically harming others
- damaging or taking property.
Figure 18: Percentage of teachers and principals who report behaviour has become much worse/worse
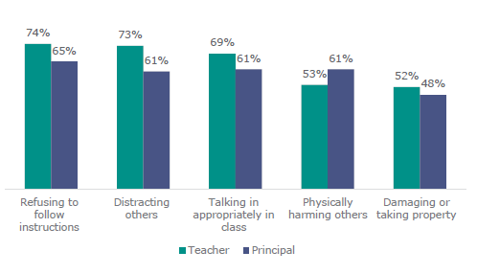
b) Refusing to follow instructions
Three-quarters of teachers say students refusing to follow instructions is worse now than two years ago.
Refusing to follow instructions is a common behaviour teachers see in classrooms. Three out of four teachers (74 percent) and two out of three principals (65 percent) report this behaviour has become worse or much worse in the last two years.
Figure 19: How teachers and principals feel refusal to follow instructions has changed in the last two years
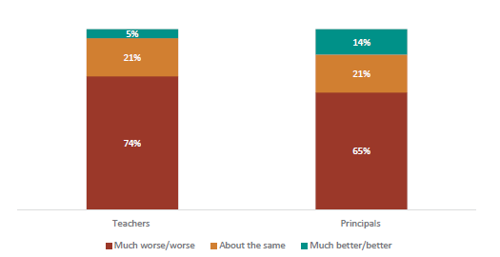
Teachers who report this behaviour getting worse or much worse most often identify it getting worse by more students refusing to follow instructions (81 percent). Fifty-nine percent report the same students showing the behaviour more often and 47 percent of teachers report the severity of the behaviour increasing.
Figure 20: Ways in which teachers report refusal has become worse (out of those who report it as much worse/worse)
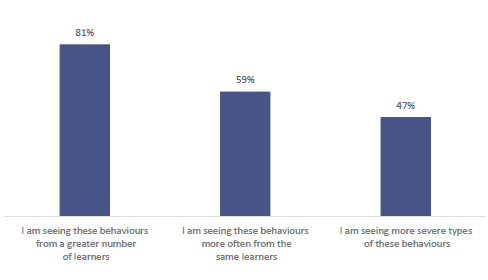
“Another type of behaviour that is presenting itself are those students who are constantly sort of rubbing… against the grain and being a little bit defiant or objectional.” (Special Educational Needs Coordinator)
c) Distracting others
Three-quarters of teachers say students distracting others is worse now than two years ago.
Students distracting others is the second most common behaviour and is reported as getting worse or much worse by three-quarters of teachers (73 percent) and six in 10 principals (61 percent).
Figure 21: How teachers and principals feel distractions in class has changed in the last two years
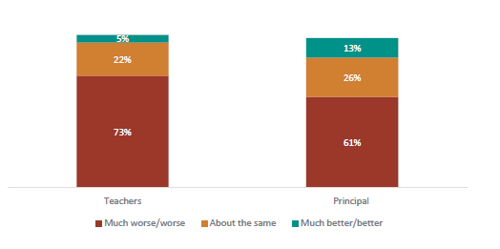
Teachers who report this behaviour getting worse or much worse most often identify it getting worse by more students distracting others (82 percent). Fifty-seven percent report the same students showing the behaviour more often and 40 percent of teachers report the severity of the behaviour increasing.
Figure 22: Ways in which teachers report distraction has become worse (out of those who report it as much worse/worse)
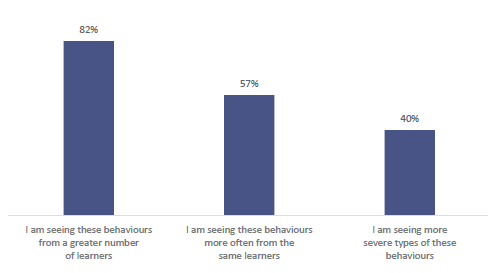
“A lot of complex needs that are presenting within each of the classrooms… may not have been identified before… [B]arriers to learning… then manifest in behaviours that children are trying to distract themselves from learning or to deflect from learning. So that is probably a very common behaviour.” (Special Educational Needs Coordinator)
d) Talking inappropriately in class
Over six in 10 teachers and principals report talking inappropriately in class as worse now than two years ago.
Talking inappropriately in class is the most common behaviour seen in classrooms. In addition to this, more than two-thirds of teachers (69 percent) and three out of five principals (61 percent) have seen inappropriate talking become worse or much worse in the last two years.
Figure 23: How teachers and principals feel talking inappropriately in class has changed in the last two years
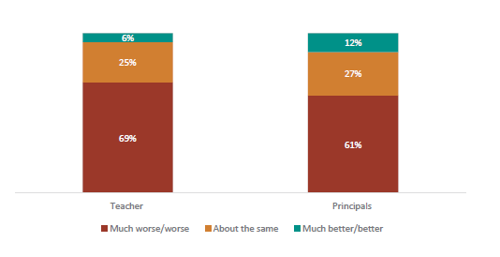
Teachers who report this behaviour getting worse or much worse most often identify it getting worse by more students talking inappropriately (80 percent). Fifty-nine percent report the same students showing the behaviour more often, and 48 percent report the severity of the behaviour increasing.
Figure 24: Ways in which teachers report talking inappropriately in class has become worse (out of those who report it as much worse/worse)
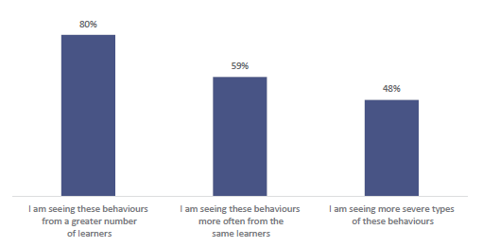
“There's a lot of language and disrespect not only towards peers, but [towards] teachers and teaching staff as well.” (Teacher)
e) Physically harming others
Over half of teachers and principals report behaviours that physically harm others as becoming worse.
Over half of teachers (53 percent) and three out of five principals (61 percent) say behaviours that physically harm others has become worse or much worse in the last two years.
Figure 25: How teachers and principals feel physically harming behaviour has changed in the last two years
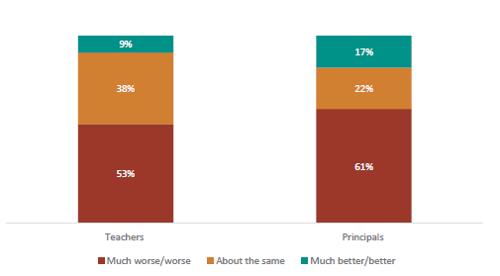
Teachers who report this behaviour getting worse or much worse most often identify it getting worse by more physically harming others (62 percent). Fifty-seven percent report the same students showing the behaviour more often and 53 percent of teachers report the severity of the behaviour increasing.
Figure 26: Ways in which teachers report physically harming behaviour has become worse (out of those who report it as much worse/worse)
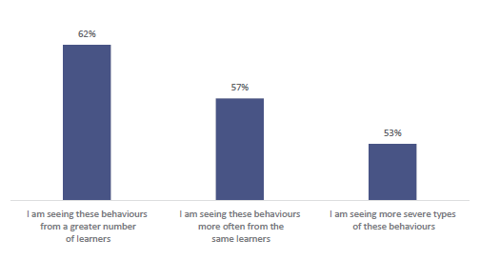
“One little boy in particular… he'd lash out. He'd kick at the teachers, he'd do anything.” (Principal)
“Going straight to physical violence from nothing. Like there is no verbal violence that happens first - it's straight to punching or hitting or grabbing. And our data shows that there's been a huge increase in those two behaviours over the last three years.” (Team leader)
f) Damaging or taking property
Half of teachers and principals report damaging and taking property as worse now than two years ago.
Half of teachers (52 percent) and principals (48 percent) feel that students taking or damaging property has become worse or much worse in the last two years.
Figure 27: How teachers and principals feel students taking or damaging property has changed in the last two years
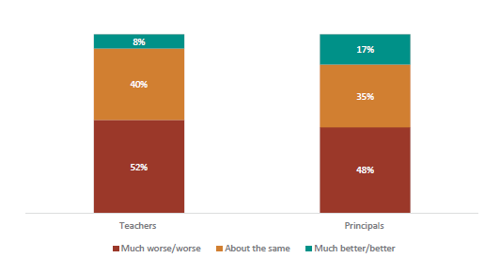
Teachers who report this behaviour getting worse or much worse most often identify it getting worse by more students damaging or taking property (62 percent). Fifty-five percent report the same students showing the behaviour more often, and 46 percent of teachers report the severity of the behaviour increasing.
Figure 28: Ways in which teachers report damaging or taking property has become worse (out of those who report it as much worse/worse)
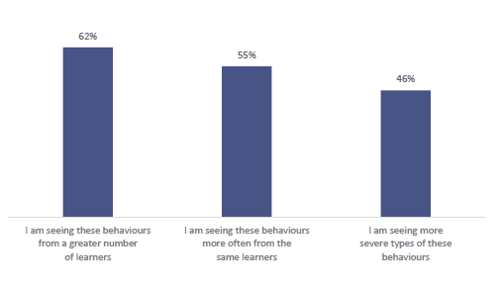
“And when he got told off, he would just throw chairs, flip his desk. Yeah. Really do anything just to get sent out of the class.” (Student)
g) Changes to the reasons for stand-downs in Aotearoa New Zealand
The following data comes from the Ministry of Education database on stand-downs, suspensions, exclusions, and expulsions.(30)
There has been an increase in stand-downs between 2019 and 2022, particularly for smoking/vaping and alcohol
During this period, stand-downs have increased from 30.1 per 1000 students to 32.6 per 1000 students (increase of 2.5 students per 1000). There have also been differences in the behaviour reasons for stand-downs across this time.
Figure 29: Percentage change in standdown rates per 1000 students across behaviour categories between 2019 and 2022
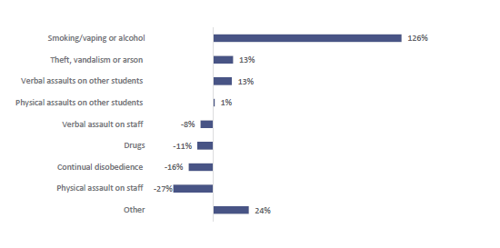
These changes show the way in which behaviour is responded to at schools. There may be other reasons for the changes like a shift in school policies. Below are a range of further reasons that may be contributing to the changes in stand-down, suspension, and exclusion rates.
h) Why behaviours are changing
Based on the research evidence base, our interviews and focus groups with schools, and interviews with experts, we established a range of potential reasons for the worsening behaviours, including:
- Covid-19
- students’ mental health
- teachers’ time pressures
- home life
- devices
- new teachers’ skills.
Covid-19
The Covid-19 pandemic has caused one of the biggest disruptions to education in Aotearoa New Zealand history. This has had a significant impact on students in Aotearoa New Zealand and across the world.(31)
Students faced threats to their physical health, the closure of their schools, adjusting to a new way of learning remotely, having to socially distance from others and then readjusting to learning in the classroom when the height of the pandemic had passed.
With long spells away from school students came back into school having lost some of their social skills and understanding about how to behave in school settings. This has been exacerbated by a fall-off in attendance.
All of this, among other challenges that the pandemic posed to students and their families, has had long term impacts on students and the behaviours teachers are seeing in the classroom. Stresses associated with the pandemic have been linked to behavioural concerns.(32)
Aotearoa New Zealand isn’t alone with these challenges. The United Kingdom has also found more disruptive behaviour in schools since the pandemic. They have found this to be especially true of persistent low-level disruption in class, such as students refusing to follow instructions, talking back to teachers, or using social media during class.(33)
In ERO’s focus groups we heard about a number of ways in which the ongoing impact of Covid-19 is presenting itself in the classroom.
Challenges with independence and time management
Teachers, leaders, and school staff identify that students don’t have the independence that they would have expected them to have before Covid-19. Linked to this, they also notice that students are not able to manage their time as well as they used to.
“Lack of independence. I’m not sure whether that is a roll on effect from being at home for so long during Covid, but we have a lot of students who are not doing things independently that possibly you would expect them to be doing at this age. So a lack of independence, a lack of organisation and time management.” (Special Educational Needs Coordinator)
“..the behaviour around time being organised. I think with what went on over the last couple of years is meeting deadlines … because they haven’t had to meet those deadlines in the same way that they would have when they were in the classroom. And it’s just installing that behaviour back into the classroom again.” (Dean)
Increased need for device use
The use of devices during the learning from home period of the Covid-19 pandemic has impacted not only students’ ability to focus but also their expectations around their right to use devices.
“I actually do think Covid and being away from school has had an impact on the kids. We’ve found there… has been a lot less focus. A lot of them want to be on devices sometimes and to the point where maybe not this year, but in previous years they’ll throw a tantrum. If they don’t get on a device, they feel it’s a right, not a privilege.” (Teacher)
Students’ mental health
Mental health is an established problem in Aotearoa New Zealand. In 2021/22, nearly one in four (23.6 percent) young people aged 15–24 years experienced high or very high levels of psychological distress, up from 11 percent in 2020.(34)
The causes of poor mental health in students varies. Covid-19 has increased students’ stress and anxiety,(35) along with other factors like academic stress and pressure to achieve, relationships with peers, and navigating their identities.(36) (It is important to note that mental health difficulties existed for young people before Covid-19, and are attributable to a number of factors such as trauma and adversity.)
In 2023 research by ERO, we heard that while happiness at school had improved from 2021, 28 percent of students were only happy at school ‘sometimes’. Thirty-six percent of teachers and 38 percent of principals are concerned that student wellbeing was worse or much worse than they would expect at that time of year (when surveyed). Secondary school students struggled with both learning disruptions and assessment disruptions. More secondary teachers thought student wellbeing was worse or much worse than they would expect (44 percent), than primary teachers (29 percent).(37)
One way in which poor mental health or a decline in mental health presents itself is though behaviour. This can include changes such as increased sleepiness, irritability, arguments with peers, disruptive behaviour in class, or difficulty paying attention.(38)
“I think there’s been a huge decline in mental health… I’ve seen a huge change in the behaviours that are coming around the students who are presenting with anxiety, who are presenting with other mental health issues.” (Special Educational Needs Coordinator)
Wellbeing
We heard from teachers and leaders that wellbeing challenges are an increasing problem in schools. Wellbeing challenges are impacting students’ ability to participate in class, which affects their behaviour.
“[For Year 13 students], a lot of wellbeing challenges that they’re experiencing since Covid, they take a lot on board… Their lives are much more complex and so some of them are coming to school and then just breaking down in tears.” (Dean)
Anxiety
Many leaders and teachers shared their belief that worsened behaviour in recent years is due to worsened anxiety. Teachers also told us that higher parental anxiety is carrying through to their children. Students’ anxiety impacts their ability to be comfortable and settled in the classroom. This again is often linked to the disruptions brought about by the Covid-19 pandemic.
“What we’ve noticed, especially around our LSC (learning support coordinator) cluster, is that the anxiety levels of kids are a lot higher and that's also then playing into the lack of resilience and parents jumping in more. And they're not able to go through that escalation of going through the anxiety and coming out the other side and figuring out those problem-solving skills because… they can opt out and back out quite easily. So, the anxiety level and the kids that are coming in with diagnosed anxiety issues is a lot more than what it was...” (Learning Support Co-ordinator)
Complex needs
ERO heard that students are presenting with a greater number of additional social, emotional, and cognitive needs (diagnosed and undiagnosed) now than they were previously. We also heard that students and their schools do not always have the supports in place to meet these needs, and this lack of support is having a big impact on the behaviours in the classroom. Resect research by ERO (39) found that many teachers are not confident to teach disabled students, and one in three disabled students do not feel supported to learn in a way that suits them. Among parents and whānau of disabled students, a similar proportion are not happy with the quality of their child’s schooling. More than half of teachers lack confidence in teaching disabled students, particularly those with complex needs who require significant adaptations (including at NZ Curriculum Level 1). Confidence among secondary school teachers is particularly low.(40)
“Massive increase in the number of students that are presenting with both cognitive, emotional and social needs.” (Principal)
“Students… are entering the school with a complexity of problems, ADHD, anxiety behaviours. So there's a whole complexity of problems that we find that are coming in. When looked at from a SENCO point of view, there are so many referrals that we're making to child health [services] … We've seen more coming in and from a younger age… So that's having a big impact on behaviours within the classroom because most of them have little supports or come in with very few supports.” (Special Educational Needs Coordinator)
Teachers’ time pressure
Teachers and leaders described the time pressure that they experience in their roles, having to address new issues, organise support, and balance the needs of all the students in their classes. We heard that the role of the teacher has become “more complicated” than previously.
“Oh, with complexity. There's a lot more time that is being needed to address all the various issues, and that puts a huge pressure on schools. Teachers in classrooms are dealing with multi-layered issues. … You just don’t go in there and stand and teach that; those days are over. It's really about how you manage the room, dealing with all the personalities, building the relationships, knowing the individual needs of all your students. So it's a complicated job now.” (Student support director)
We also heard that stress from managing challenging behaviour in the classroom limits teachers’ ability to engage in some of the effective practices that might prevent those behaviours happening in the first place.
“When people are under a huge amount of stress like teachers are, it actually limits your ability to engage them in evidence based [practices] of what would work to manage certain kinds of behaviour. It's quite surprising after a number of years of schools engaging quite heavily in [programmes], you would have thought that there would have been a higher level of shared language and understanding. That’s what’s wearing our colleagues out as well… some of the strategies and suggestions that normally work, that are the run of the mill kind of things, are not just working. [This is] because teachers are so stressed and so overwhelmed by the volume of behavioural incidents that they have, that they seem to fight fires on a case-by-case basis.” (Resource teacher)
Home life
Home life has an enormous impact on students.(41) Aspects of students’ home lives, like how involved their parents and whānau are, family structures, number of siblings, grandparents’ support, financial stability, socioeconomic status, and trauma, all influence how a student behaves and performs at school.(42) Parental involvement with school, including speaking with teachers on a regular basis, can result in a decrease in student disruptive behaviours.(43) Additionally, the current cost of living crisis is putting further strain on families, worsening the stressors faced within home life.
Coming to school unprepared
We heard that more students are coming to school unprepared. This is sometimes due to students experiencing a disrupted home life, because of Covid-19 disruptions, emergency housing situations, or general instability, leaving many students unsettled. Many students are also experiencing a lack of learning at home, which has an impact on whether they are learning-ready in the classroom.
“I think there are a lot of housing issues which has meant that the transience is quite huge, and that brings a different level of behaviour because it's affecting academics as well. So they just aren't settled.” (Assistant principal)
Differing expectations
We heard that parents’ and schools’ expectations can differ in terms of what is considered acceptable behaviour or acceptable ways of managing behaviour. These differing expectations get in the way of parents and staff working together as a team, and can lead to an oppositional dynamic. We heard about these sorts of disagreements between staff and parents of the student displaying the behaviour, as well as with the parents of other students in the class. Teachers and leaders reported times when parents backed their child about behaviour issues, rather than the school, which results in mixed messages for that student.
“Sometimes it's the parent that's not supporting you as the teacher. They will back their child no matter what the behaviour and it's everyone else's fault but their child.” (Teacher)
“We feel there's a bit of a shift in power with families and that sometimes children… who are ruling the roost at home a little bit and the parents have sort of handed her over. I've noticed that definitely throughout my teaching career.” (Dean/teacher)
Devices
Since 2019 and the start of the Covid-19 pandemic, there has been a notable increase in the use of devices and the internet.(44) While this increase in connectivity allowed students to learn from home throughout the pandemic,(45) there are also concerns about the impact of too much screen time.(46) The negative impacts of excessive technology use are linked to:
- physical concerns like a lack of physical exercise, vision problems, or trouble falling asleep
- mental health concerns such as the impact of social media on anxiety and depression, stress and isolation, and attention issues.(47)
Inappropriate content
We heard about a wider range of inappropriate behaviours, often sexualised, that are occurring more frequently. These are attributable to the increased exposure to unrestricted media on phones, tablets, and other devices.
“I've been teaching for over 20 years. As we've gone through the years, the children are getting younger with their sexualised behaviour. When you've got Year 3-4 children making gestures … years ago that was just unheard of. And now they seem to know more, or they've picked up more, from being on the internet and everything like that.” (Teacher)
Concentration and language impacts
Teachers and leaders told us that devices have also played a role in the decline of students’ oral language when they start school, and their progress once at school. Without having the words to express themselves, students are displaying frustrated behaviours. Students’ ability to concentrate on content that is not as visually stimulating as the games that they play on devices is also lower.
“Children that are entering the school… have spent obviously a lot of time on devices. The oral language is very poor and there's… quite a bit of frustration for the fact they find it difficult to express themselves. And again, the fatigue, the tiredness.” (Special Educational Needs Coordinator)
“The fact is they’re on games all the time, so the oral language has taken a big hit. And also the fact that we’re now competing with a digital world where you can get what you want straight away. You’ve got all this instant gratification on the screen and you’ve got all these flashing lights and things. And we’re finding… that the little ones won’t watch a movie because unless it’s got a lot of flashing and a lot of visual stimulation, they’re not going to listen to dialogue like Finding Nemo. You couldn’t get them to sit through that because there’s too much dialogue.” (Special Educational Needs Coordinator)
New teachers’ skills
Following initial teacher education, under half (45 percent) of new teachers report being capable in managing classroom behaviours and that they have to learn these skills on the job.(48) New teachers are now entering more challenging classrooms and may lack the skills needed to manage challenging classroom behaviours.
2) How does the change in behaviour look across different schools?
This section sets out what we know about the changes in behaviour over time when looking across different contexts, including:
- school age group
- school size
- schools in high and low socioeconomic communities
- teacher gender
- teacher experience.
a) School age group
Physically harming behaviours are getting worse at primary school.
Teachers at primary school are nearly 1.5 times more likely to identify physical behaviour as getting worse or much worse (63 percent) compared to teachers at secondary school (44 percent).
Behaviours that distract from learning are getting worse at secondary school.
Teachers at secondary schools are more likely to identify these behaviours as getting worse or much worse (78 percent) compared to teachers at primary (68 percent) or intermediate schools (64 percent).
Figure 30: Percentage of teachers identifying behaviours as becoming worse or much worse across school age group
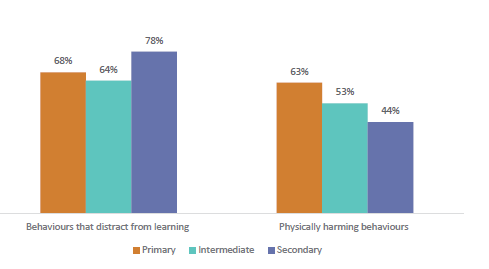
As noted above, behaviours can present in different ways for students of different ages. These findings are consistent with the differences we saw for how frequently behaviours are occurring at each level, with physical behaviours occurring more frequently at primary compared to secondary and behaviours that distract happening most frequently at secondary compared to primary.
b) School size
Behaviours are getting worse at large schools more often than at smaller schools.
More teachers and principals at large schools see behaviour getting worse, compared to teachers and principals at smaller schools. Teachers at large schools find that refusal is becoming worse or much worse more often (77 percent) than with smaller schools (68 percent). When it comes to behaviour overall, eight in 10 principals (82 percent) find that behaviour overall has become worse or much worse, compared with just over half (55 percent) of principals at smaller schools.
Figure 31: Principals’ experience of behaviour overall changing by school size
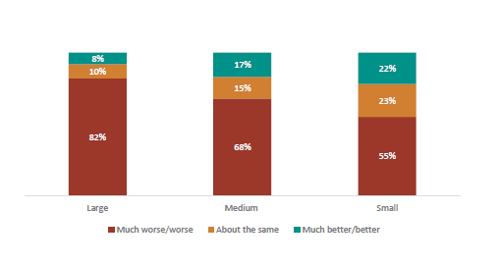
Smaller schools with a closer-knit community, are better able to and predict and prevent behaviour problems, so don’t experience worsening behaviour at the same rate that larger schools do.
c) Schools in high and low socioeconomic communities
There was no difference in how behaviour had changed over time across schools in high and low socioeconomic communities.
d) Teachers’ gender
Female teachers more often experience behaviour becoming worse.
Female teachers find that all types of behaviour have become worse more often than male teachers. For behaviour overall, three-quarters (76 percent) of female teachers find that it has become worse or much worse compared to two-thirds (67 percent) of male teachers. This is particularly apparent for physically harming behaviours where 57 percent of females feel it has become worse or much worse compared to 40 percent of males.
Figure 32: Percentage of males and females teachers who feel behaviour has become worse or much worse
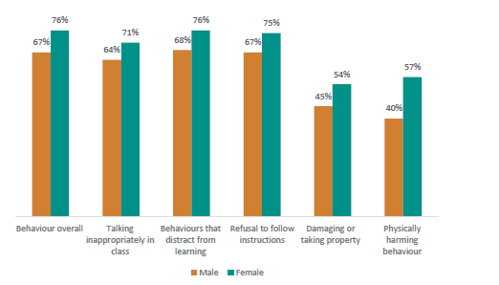
e) Teachers’ experience
Teachers and principals with more experience more often report behaviours are becoming worse.
Four out of five (81 percent) of teachers with six to nine years’ experience and 78 percent of teachers with 10 or more years’ experience think behaviour overall has become worse or much worse, compared to 56 percent of teachers with less than five years’ experience.
Figure 33: Teachers reporting behaviour overall getting worse or much worse by experience
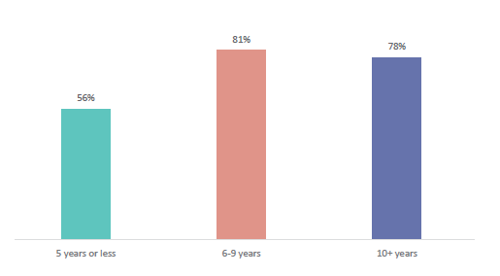
It is possible that teachers and principals with more experience have a clearer sense of the change in behaviour from two years ago than those who have started teaching more recently.
Conclusion
Overall, behaviour has become worse, and most commonly this is because of a greater number of students displaying challenging behaviours. Refusing to follow instructions and behaviours that distract others are identified most often by teachers as having become worse.
Many behaviours are also identified more often as getting worse at large schools compared to small schools. Female teachers more often experience behaviour becoming worse.
There are a range of potential reasons for the changes in behaviour in recent times, including factors such as Covid-19 related disruptions, changes to lifestyle, home life, mental health (such as increases in anxiety), and increased use and reliance on devices.
Student behaviour is getting worse and this has impacts for all students. Teachers observe an increase in challenging classroom behaviours, particularly through a greater number of students displaying such behaviours. Teachers attribute these changes to a range of factors such as Covid-19 impacts, changes to home-life, increased mental health challenges, and device use.
We know that challenging behaviours are occurring at a high rate in our classrooms. In addition to this, teachers are experiencing an increase in these challenging classroom behaviours in recent years. This means that students are experiencing less focused teaching and learning time in classes.
To understand how behaviour has changed, and why, we looked at:
- Ministry of Education statistics on the frequency of stand-downs
- our surveys of teachers and principals
- our interviews with teachers, leaders, parents and whānau
- PISA results.
This chapter sets out:
- how the behaviours have changed over time
- how the behaviours have changed at different schools.
What we found: An overview
Student behaviour is getting worse. Three-quarters of teachers (74 percent) and principals (70 percent) report that behaviour overall has become much worse/worse in the last two years.
Nearly all teachers who report behaviour is worse say a greater number of students are displaying challenging behaviours. Eighty-four percent of teachers who report behaviour has become much worse/worse say a greater number of students are displaying challenging behaviours.
Teachers report that refusing to follow instructions and distracting others are the behaviours that have become worse most often. Three out of four teachers report that refusing to follow instructions (74 percent) and distracting others (73 percent) have become much worse/worse in the last two years.
1) What do we know about the changes in behaviour over time?
We asked teachers and principals how behaviour has changed in the last two years (or since they started teaching if this is less than two years). Teachers and principals identify all types of classroom behaviour as getting worse.
This section sets out what we know about the changes in behaviour over time, including:
- overall behaviour
- refusing to follow instructions
- distracting others
- talking in appropriately in class
- physically harming others
- damaging or taking property
- changes to the reasons for stand-downs in Aotearoa New Zealand
- why behaviours are changing.
a) Behaviour overall
ERO has been concerned about behaviour throughout Covid-19, which we discuss in greater detail later in this chapter. In Term 2 of 2021, we found that 39 percent of principals reported that behaviour was worse or much worse than they would expect at this time of year. In Term 1 of 2023, we found that 41 percent of principals reported that behaviour was worse or much worse than they would expect at that time of year. We heard in this research that Covid-19 was one contributing factor in why behaviour is changing.
Figure 14: Teachers reporting behaviour is much worse/worse than they would expect for that time of the year across time
In Term 3 of 2023, we asked a similar question to look at changes in behaviour overall and different behaviour categories over the last two years. These are covered next.
Over seven in 10 teachers and principals say behaviour overall has become worse and this is most often due to a larger number of students presenting these behaviours.
The majority of teachers and principals indicate behaviour is becoming worse. Three-quarters of teachers (74 percent) and 70 percent of principals report behaviour has become worse or much worse in the last two years.
Figure 15: Teachers’ and principals’ perception of behaviour change overall in the last two years
Nearly all (84 percent) teachers who feel behaviour is worse or much worse, say a greater number of students are displaying challenging behaviour. Fifty-nine percent of teachers who feel it has become worse or much worse attribute it to seeing it more often from the same students and 58 percent to the severity of the behaviours increasing.
Figure 16: Ways in which teachers report behaviour overall has become worse (out of those who report it as much worse/worse)
PISA 2022 results show that in the last 10 years there has been an increase in the percentage of students identifying the following negative behaviours in most or every maths lesson.
- Students are not working well in most or every lesson (4 percent point increase since 2012).
- Students do not start working for a long time after the lesson begins (2 percent point increase since 2012).
Additionally, over the past two decades (between 2000 and 2018) there has been a steady rise in the proportion of students in noisy and disorderly classrooms (from 33 percent to 42 percent) and in classrooms where students don’t listen to the teacher (from 24 percent to 35 percent).(29)
Figure 17: Students not listening to the teacher and noise and disorder from 2000 to 2018
In focus groups we heard one of the key changes to behaviour is the increase in complex needs in the classroom, such as younger children entering school with very low levels of oral language and an increase in anxiety (from both students and their parents).
“We find that issues are more multi-layered and complex in nature, and there's always a reason for behaviour. And when we dig into those reasons for behaviour, we find that there's a lot going on in children’s lives and… in families’ lives and in teachers’ lives. So our lives feel more complex.” (Student support director)
In focus groups we also heard about students not learning from previous behaviour corrections and repeating the same behaviours.
“For me speaking to children that might get sent out of the classroom, it's like they understand what they've done wrong and you're able to talk through it, but it doesn't mean they're going to learn from it and not do it again. So that's the continuous cycle of repeating the behaviour or behaviours and not actually like taking on board what they said, then sort of making the change themselves as a person, changing their own behaviour. It's a lot of repetition of it.” (Principal)
Teachers identify these areas as having become worse the most frequently (in order):
- refusing to follow instructions
- distracting others
- talking in appropriately in class
- physically harming others
- damaging or taking property.
Figure 18: Percentage of teachers and principals who report behaviour has become much worse/worse
b) Refusing to follow instructions
Three-quarters of teachers say students refusing to follow instructions is worse now than two years ago.
Refusing to follow instructions is a common behaviour teachers see in classrooms. Three out of four teachers (74 percent) and two out of three principals (65 percent) report this behaviour has become worse or much worse in the last two years.
Figure 19: How teachers and principals feel refusal to follow instructions has changed in the last two years
Teachers who report this behaviour getting worse or much worse most often identify it getting worse by more students refusing to follow instructions (81 percent). Fifty-nine percent report the same students showing the behaviour more often and 47 percent of teachers report the severity of the behaviour increasing.
Figure 20: Ways in which teachers report refusal has become worse (out of those who report it as much worse/worse)
“Another type of behaviour that is presenting itself are those students who are constantly sort of rubbing… against the grain and being a little bit defiant or objectional.” (Special Educational Needs Coordinator)
c) Distracting others
Three-quarters of teachers say students distracting others is worse now than two years ago.
Students distracting others is the second most common behaviour and is reported as getting worse or much worse by three-quarters of teachers (73 percent) and six in 10 principals (61 percent).
Figure 21: How teachers and principals feel distractions in class has changed in the last two years
Teachers who report this behaviour getting worse or much worse most often identify it getting worse by more students distracting others (82 percent). Fifty-seven percent report the same students showing the behaviour more often and 40 percent of teachers report the severity of the behaviour increasing.
Figure 22: Ways in which teachers report distraction has become worse (out of those who report it as much worse/worse)
“A lot of complex needs that are presenting within each of the classrooms… may not have been identified before… [B]arriers to learning… then manifest in behaviours that children are trying to distract themselves from learning or to deflect from learning. So that is probably a very common behaviour.” (Special Educational Needs Coordinator)
d) Talking inappropriately in class
Over six in 10 teachers and principals report talking inappropriately in class as worse now than two years ago.
Talking inappropriately in class is the most common behaviour seen in classrooms. In addition to this, more than two-thirds of teachers (69 percent) and three out of five principals (61 percent) have seen inappropriate talking become worse or much worse in the last two years.
Figure 23: How teachers and principals feel talking inappropriately in class has changed in the last two years
Teachers who report this behaviour getting worse or much worse most often identify it getting worse by more students talking inappropriately (80 percent). Fifty-nine percent report the same students showing the behaviour more often, and 48 percent report the severity of the behaviour increasing.
Figure 24: Ways in which teachers report talking inappropriately in class has become worse (out of those who report it as much worse/worse)
“There's a lot of language and disrespect not only towards peers, but [towards] teachers and teaching staff as well.” (Teacher)
e) Physically harming others
Over half of teachers and principals report behaviours that physically harm others as becoming worse.
Over half of teachers (53 percent) and three out of five principals (61 percent) say behaviours that physically harm others has become worse or much worse in the last two years.
Figure 25: How teachers and principals feel physically harming behaviour has changed in the last two years
Teachers who report this behaviour getting worse or much worse most often identify it getting worse by more physically harming others (62 percent). Fifty-seven percent report the same students showing the behaviour more often and 53 percent of teachers report the severity of the behaviour increasing.
Figure 26: Ways in which teachers report physically harming behaviour has become worse (out of those who report it as much worse/worse)
“One little boy in particular… he'd lash out. He'd kick at the teachers, he'd do anything.” (Principal)
“Going straight to physical violence from nothing. Like there is no verbal violence that happens first - it's straight to punching or hitting or grabbing. And our data shows that there's been a huge increase in those two behaviours over the last three years.” (Team leader)
f) Damaging or taking property
Half of teachers and principals report damaging and taking property as worse now than two years ago.
Half of teachers (52 percent) and principals (48 percent) feel that students taking or damaging property has become worse or much worse in the last two years.
Figure 27: How teachers and principals feel students taking or damaging property has changed in the last two years
Teachers who report this behaviour getting worse or much worse most often identify it getting worse by more students damaging or taking property (62 percent). Fifty-five percent report the same students showing the behaviour more often, and 46 percent of teachers report the severity of the behaviour increasing.
Figure 28: Ways in which teachers report damaging or taking property has become worse (out of those who report it as much worse/worse)
“And when he got told off, he would just throw chairs, flip his desk. Yeah. Really do anything just to get sent out of the class.” (Student)
g) Changes to the reasons for stand-downs in Aotearoa New Zealand
The following data comes from the Ministry of Education database on stand-downs, suspensions, exclusions, and expulsions.(30)
There has been an increase in stand-downs between 2019 and 2022, particularly for smoking/vaping and alcohol
During this period, stand-downs have increased from 30.1 per 1000 students to 32.6 per 1000 students (increase of 2.5 students per 1000). There have also been differences in the behaviour reasons for stand-downs across this time.
Figure 29: Percentage change in standdown rates per 1000 students across behaviour categories between 2019 and 2022
These changes show the way in which behaviour is responded to at schools. There may be other reasons for the changes like a shift in school policies. Below are a range of further reasons that may be contributing to the changes in stand-down, suspension, and exclusion rates.
h) Why behaviours are changing
Based on the research evidence base, our interviews and focus groups with schools, and interviews with experts, we established a range of potential reasons for the worsening behaviours, including:
- Covid-19
- students’ mental health
- teachers’ time pressures
- home life
- devices
- new teachers’ skills.
Covid-19
The Covid-19 pandemic has caused one of the biggest disruptions to education in Aotearoa New Zealand history. This has had a significant impact on students in Aotearoa New Zealand and across the world.(31)
Students faced threats to their physical health, the closure of their schools, adjusting to a new way of learning remotely, having to socially distance from others and then readjusting to learning in the classroom when the height of the pandemic had passed.
With long spells away from school students came back into school having lost some of their social skills and understanding about how to behave in school settings. This has been exacerbated by a fall-off in attendance.
All of this, among other challenges that the pandemic posed to students and their families, has had long term impacts on students and the behaviours teachers are seeing in the classroom. Stresses associated with the pandemic have been linked to behavioural concerns.(32)
Aotearoa New Zealand isn’t alone with these challenges. The United Kingdom has also found more disruptive behaviour in schools since the pandemic. They have found this to be especially true of persistent low-level disruption in class, such as students refusing to follow instructions, talking back to teachers, or using social media during class.(33)
In ERO’s focus groups we heard about a number of ways in which the ongoing impact of Covid-19 is presenting itself in the classroom.
Challenges with independence and time management
Teachers, leaders, and school staff identify that students don’t have the independence that they would have expected them to have before Covid-19. Linked to this, they also notice that students are not able to manage their time as well as they used to.
“Lack of independence. I’m not sure whether that is a roll on effect from being at home for so long during Covid, but we have a lot of students who are not doing things independently that possibly you would expect them to be doing at this age. So a lack of independence, a lack of organisation and time management.” (Special Educational Needs Coordinator)
“..the behaviour around time being organised. I think with what went on over the last couple of years is meeting deadlines … because they haven’t had to meet those deadlines in the same way that they would have when they were in the classroom. And it’s just installing that behaviour back into the classroom again.” (Dean)
Increased need for device use
The use of devices during the learning from home period of the Covid-19 pandemic has impacted not only students’ ability to focus but also their expectations around their right to use devices.
“I actually do think Covid and being away from school has had an impact on the kids. We’ve found there… has been a lot less focus. A lot of them want to be on devices sometimes and to the point where maybe not this year, but in previous years they’ll throw a tantrum. If they don’t get on a device, they feel it’s a right, not a privilege.” (Teacher)
Students’ mental health
Mental health is an established problem in Aotearoa New Zealand. In 2021/22, nearly one in four (23.6 percent) young people aged 15–24 years experienced high or very high levels of psychological distress, up from 11 percent in 2020.(34)
The causes of poor mental health in students varies. Covid-19 has increased students’ stress and anxiety,(35) along with other factors like academic stress and pressure to achieve, relationships with peers, and navigating their identities.(36) (It is important to note that mental health difficulties existed for young people before Covid-19, and are attributable to a number of factors such as trauma and adversity.)
In 2023 research by ERO, we heard that while happiness at school had improved from 2021, 28 percent of students were only happy at school ‘sometimes’. Thirty-six percent of teachers and 38 percent of principals are concerned that student wellbeing was worse or much worse than they would expect at that time of year (when surveyed). Secondary school students struggled with both learning disruptions and assessment disruptions. More secondary teachers thought student wellbeing was worse or much worse than they would expect (44 percent), than primary teachers (29 percent).(37)
One way in which poor mental health or a decline in mental health presents itself is though behaviour. This can include changes such as increased sleepiness, irritability, arguments with peers, disruptive behaviour in class, or difficulty paying attention.(38)
“I think there’s been a huge decline in mental health… I’ve seen a huge change in the behaviours that are coming around the students who are presenting with anxiety, who are presenting with other mental health issues.” (Special Educational Needs Coordinator)
Wellbeing
We heard from teachers and leaders that wellbeing challenges are an increasing problem in schools. Wellbeing challenges are impacting students’ ability to participate in class, which affects their behaviour.
“[For Year 13 students], a lot of wellbeing challenges that they’re experiencing since Covid, they take a lot on board… Their lives are much more complex and so some of them are coming to school and then just breaking down in tears.” (Dean)
Anxiety
Many leaders and teachers shared their belief that worsened behaviour in recent years is due to worsened anxiety. Teachers also told us that higher parental anxiety is carrying through to their children. Students’ anxiety impacts their ability to be comfortable and settled in the classroom. This again is often linked to the disruptions brought about by the Covid-19 pandemic.
“What we’ve noticed, especially around our LSC (learning support coordinator) cluster, is that the anxiety levels of kids are a lot higher and that's also then playing into the lack of resilience and parents jumping in more. And they're not able to go through that escalation of going through the anxiety and coming out the other side and figuring out those problem-solving skills because… they can opt out and back out quite easily. So, the anxiety level and the kids that are coming in with diagnosed anxiety issues is a lot more than what it was...” (Learning Support Co-ordinator)
Complex needs
ERO heard that students are presenting with a greater number of additional social, emotional, and cognitive needs (diagnosed and undiagnosed) now than they were previously. We also heard that students and their schools do not always have the supports in place to meet these needs, and this lack of support is having a big impact on the behaviours in the classroom. Resect research by ERO (39) found that many teachers are not confident to teach disabled students, and one in three disabled students do not feel supported to learn in a way that suits them. Among parents and whānau of disabled students, a similar proportion are not happy with the quality of their child’s schooling. More than half of teachers lack confidence in teaching disabled students, particularly those with complex needs who require significant adaptations (including at NZ Curriculum Level 1). Confidence among secondary school teachers is particularly low.(40)
“Massive increase in the number of students that are presenting with both cognitive, emotional and social needs.” (Principal)
“Students… are entering the school with a complexity of problems, ADHD, anxiety behaviours. So there's a whole complexity of problems that we find that are coming in. When looked at from a SENCO point of view, there are so many referrals that we're making to child health [services] … We've seen more coming in and from a younger age… So that's having a big impact on behaviours within the classroom because most of them have little supports or come in with very few supports.” (Special Educational Needs Coordinator)
Teachers’ time pressure
Teachers and leaders described the time pressure that they experience in their roles, having to address new issues, organise support, and balance the needs of all the students in their classes. We heard that the role of the teacher has become “more complicated” than previously.
“Oh, with complexity. There's a lot more time that is being needed to address all the various issues, and that puts a huge pressure on schools. Teachers in classrooms are dealing with multi-layered issues. … You just don’t go in there and stand and teach that; those days are over. It's really about how you manage the room, dealing with all the personalities, building the relationships, knowing the individual needs of all your students. So it's a complicated job now.” (Student support director)
We also heard that stress from managing challenging behaviour in the classroom limits teachers’ ability to engage in some of the effective practices that might prevent those behaviours happening in the first place.
“When people are under a huge amount of stress like teachers are, it actually limits your ability to engage them in evidence based [practices] of what would work to manage certain kinds of behaviour. It's quite surprising after a number of years of schools engaging quite heavily in [programmes], you would have thought that there would have been a higher level of shared language and understanding. That’s what’s wearing our colleagues out as well… some of the strategies and suggestions that normally work, that are the run of the mill kind of things, are not just working. [This is] because teachers are so stressed and so overwhelmed by the volume of behavioural incidents that they have, that they seem to fight fires on a case-by-case basis.” (Resource teacher)
Home life
Home life has an enormous impact on students.(41) Aspects of students’ home lives, like how involved their parents and whānau are, family structures, number of siblings, grandparents’ support, financial stability, socioeconomic status, and trauma, all influence how a student behaves and performs at school.(42) Parental involvement with school, including speaking with teachers on a regular basis, can result in a decrease in student disruptive behaviours.(43) Additionally, the current cost of living crisis is putting further strain on families, worsening the stressors faced within home life.
Coming to school unprepared
We heard that more students are coming to school unprepared. This is sometimes due to students experiencing a disrupted home life, because of Covid-19 disruptions, emergency housing situations, or general instability, leaving many students unsettled. Many students are also experiencing a lack of learning at home, which has an impact on whether they are learning-ready in the classroom.
“I think there are a lot of housing issues which has meant that the transience is quite huge, and that brings a different level of behaviour because it's affecting academics as well. So they just aren't settled.” (Assistant principal)
Differing expectations
We heard that parents’ and schools’ expectations can differ in terms of what is considered acceptable behaviour or acceptable ways of managing behaviour. These differing expectations get in the way of parents and staff working together as a team, and can lead to an oppositional dynamic. We heard about these sorts of disagreements between staff and parents of the student displaying the behaviour, as well as with the parents of other students in the class. Teachers and leaders reported times when parents backed their child about behaviour issues, rather than the school, which results in mixed messages for that student.
“Sometimes it's the parent that's not supporting you as the teacher. They will back their child no matter what the behaviour and it's everyone else's fault but their child.” (Teacher)
“We feel there's a bit of a shift in power with families and that sometimes children… who are ruling the roost at home a little bit and the parents have sort of handed her over. I've noticed that definitely throughout my teaching career.” (Dean/teacher)
Devices
Since 2019 and the start of the Covid-19 pandemic, there has been a notable increase in the use of devices and the internet.(44) While this increase in connectivity allowed students to learn from home throughout the pandemic,(45) there are also concerns about the impact of too much screen time.(46) The negative impacts of excessive technology use are linked to:
- physical concerns like a lack of physical exercise, vision problems, or trouble falling asleep
- mental health concerns such as the impact of social media on anxiety and depression, stress and isolation, and attention issues.(47)
Inappropriate content
We heard about a wider range of inappropriate behaviours, often sexualised, that are occurring more frequently. These are attributable to the increased exposure to unrestricted media on phones, tablets, and other devices.
“I've been teaching for over 20 years. As we've gone through the years, the children are getting younger with their sexualised behaviour. When you've got Year 3-4 children making gestures … years ago that was just unheard of. And now they seem to know more, or they've picked up more, from being on the internet and everything like that.” (Teacher)
Concentration and language impacts
Teachers and leaders told us that devices have also played a role in the decline of students’ oral language when they start school, and their progress once at school. Without having the words to express themselves, students are displaying frustrated behaviours. Students’ ability to concentrate on content that is not as visually stimulating as the games that they play on devices is also lower.
“Children that are entering the school… have spent obviously a lot of time on devices. The oral language is very poor and there's… quite a bit of frustration for the fact they find it difficult to express themselves. And again, the fatigue, the tiredness.” (Special Educational Needs Coordinator)
“The fact is they’re on games all the time, so the oral language has taken a big hit. And also the fact that we’re now competing with a digital world where you can get what you want straight away. You’ve got all this instant gratification on the screen and you’ve got all these flashing lights and things. And we’re finding… that the little ones won’t watch a movie because unless it’s got a lot of flashing and a lot of visual stimulation, they’re not going to listen to dialogue like Finding Nemo. You couldn’t get them to sit through that because there’s too much dialogue.” (Special Educational Needs Coordinator)
New teachers’ skills
Following initial teacher education, under half (45 percent) of new teachers report being capable in managing classroom behaviours and that they have to learn these skills on the job.(48) New teachers are now entering more challenging classrooms and may lack the skills needed to manage challenging classroom behaviours.
2) How does the change in behaviour look across different schools?
This section sets out what we know about the changes in behaviour over time when looking across different contexts, including:
- school age group
- school size
- schools in high and low socioeconomic communities
- teacher gender
- teacher experience.
a) School age group
Physically harming behaviours are getting worse at primary school.
Teachers at primary school are nearly 1.5 times more likely to identify physical behaviour as getting worse or much worse (63 percent) compared to teachers at secondary school (44 percent).
Behaviours that distract from learning are getting worse at secondary school.
Teachers at secondary schools are more likely to identify these behaviours as getting worse or much worse (78 percent) compared to teachers at primary (68 percent) or intermediate schools (64 percent).
Figure 30: Percentage of teachers identifying behaviours as becoming worse or much worse across school age group
As noted above, behaviours can present in different ways for students of different ages. These findings are consistent with the differences we saw for how frequently behaviours are occurring at each level, with physical behaviours occurring more frequently at primary compared to secondary and behaviours that distract happening most frequently at secondary compared to primary.
b) School size
Behaviours are getting worse at large schools more often than at smaller schools.
More teachers and principals at large schools see behaviour getting worse, compared to teachers and principals at smaller schools. Teachers at large schools find that refusal is becoming worse or much worse more often (77 percent) than with smaller schools (68 percent). When it comes to behaviour overall, eight in 10 principals (82 percent) find that behaviour overall has become worse or much worse, compared with just over half (55 percent) of principals at smaller schools.
Figure 31: Principals’ experience of behaviour overall changing by school size
Smaller schools with a closer-knit community, are better able to and predict and prevent behaviour problems, so don’t experience worsening behaviour at the same rate that larger schools do.
c) Schools in high and low socioeconomic communities
There was no difference in how behaviour had changed over time across schools in high and low socioeconomic communities.
d) Teachers’ gender
Female teachers more often experience behaviour becoming worse.
Female teachers find that all types of behaviour have become worse more often than male teachers. For behaviour overall, three-quarters (76 percent) of female teachers find that it has become worse or much worse compared to two-thirds (67 percent) of male teachers. This is particularly apparent for physically harming behaviours where 57 percent of females feel it has become worse or much worse compared to 40 percent of males.
Figure 32: Percentage of males and females teachers who feel behaviour has become worse or much worse
e) Teachers’ experience
Teachers and principals with more experience more often report behaviours are becoming worse.
Four out of five (81 percent) of teachers with six to nine years’ experience and 78 percent of teachers with 10 or more years’ experience think behaviour overall has become worse or much worse, compared to 56 percent of teachers with less than five years’ experience.
Figure 33: Teachers reporting behaviour overall getting worse or much worse by experience
It is possible that teachers and principals with more experience have a clearer sense of the change in behaviour from two years ago than those who have started teaching more recently.
Conclusion
Overall, behaviour has become worse, and most commonly this is because of a greater number of students displaying challenging behaviours. Refusing to follow instructions and behaviours that distract others are identified most often by teachers as having become worse.
Many behaviours are also identified more often as getting worse at large schools compared to small schools. Female teachers more often experience behaviour becoming worse.
There are a range of potential reasons for the changes in behaviour in recent times, including factors such as Covid-19 related disruptions, changes to lifestyle, home life, mental health (such as increases in anxiety), and increased use and reliance on devices.
Chapter 4: What is the impact of classroom behaviours?
Challenging behaviours in the classroom have a large impact on the experience of students, teachers, and principals. They impact on students’ ability to engage with lessons, the progress they make, and their enjoyment of school. For teachers, dealing with challenging behaviours consumes too much classroom time, takes a large toll on their wellbeing, and for many, impacts their desire to stay in the profession. Principals also spend large amounts of their time dealing with challenging behaviours, causing them stress.
We know that challenging behaviours are occurring in classrooms across Aotearoa New Zealand every day. As teachers’ and students’ time is limited, time spent managing and responding to behaviour takes away from learning. There are a number of impacts that behaviour in the classroom has on students.
To understand the impact of classroom behaviours on students, parents and whānau, teachers, and principals we looked at:
- international and local evidence about engagement and attainment
- our surveys of teachers and principals
- our interviews with teachers, leaders, parents and whānau.
This section sets out the impact on students, parents and whānau, teachers, and principals. It covers:
- what the impact is on other students
- what the impact on teachers and principals is
- how the impact looks across different schools.
What we found: An overview
Students’ learning and progress is highly impacted by classroom behaviours. One fifth of teachers (21 percent) and two fifths of principals (40 percent) spend more than an hour a day responding to classroom behaviour. Most teachers see this impact on students’ learning and progress. We also heard that secondary students are particularly worried about the impact on their preparation for exams.
Students’ enjoyment is impacted. About two-thirds of teachers (68 percent) and principals (63 percent) find that challenging behaviour in the classroom has a large impact on student enjoyment.
Classroom behaviour is impacting the likelihood of teachers staying in the profession. Teachers experience large impacts on their wellbeing through mental health, physical health, and stress. Half of teachers (50 percent) say this has a large impact on their intention to stay in the profession.
Principals are also facing difficulties. Over half of principals report poor student behaviour has a large impact on their stress (59 percent) and enjoyment of the job (58 percent).
1) What is the impact on other students?
This section sets out what we know about the impacts on other students, including:
- learning and progress
- enjoyment at school.
Classroom behaviours have a large impact on students, shaping their academic performance, emotional wellbeing, and enjoyment of learning. A positive and well-managed classroom environment can enhance students’ engagement, motivation, experience of school, and their achievement.
a) Student learning and progress
Students’ progress is highly impacted by classroom behaviours, with three-quarters of teachers reporting large concerns about their students’ progress.
Most school staff are concerned about the impact of classroom behaviours on the progress of their students with three-quarters of teachers (74 percent) and just under two-thirds of principals (63 percent) saying that responding to challenging behaviour in the classroom impacts students’ progress to a large or very large extent.
Figure 34: Teacher and principal perceived impact on student progress
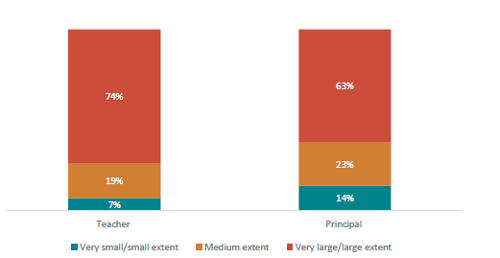
International evidence (PISA) also found the link between behaviour and achievement. They found students in the most well-behaved maths classes scored significantly higher (mean maths score of 512) than all other students, and students in the worst-behaved classes scored the lowest (mean maths score of 468, a difference of 44).(49)
We heard staff and students are concerned about teachers focusing on managing students’ behaviour rather than on teaching. They expressed concern about students’ learning being disrupted and students becoming distracted.
“[When students] become frustrated… they'll often disrupt the learning for others as well.” (Primary school principal)
“My biggest concern is not so much for me but for the children who have to hear [the behaviours] and get drawn into it… Their learning gets disrupted all the time. You're having to stop to address that issue, the other children get distracted… and it's just… a big snowball effect. You feel bad as a teacher that you're not giving the children who are always doing the right thing the attention they should be getting.” (Teacher)
“It's kind of distracting because when other people get told off, everyone just looks in that direction and doesn't focus on the work.” (Student)
Behaviour management is taking large amounts of time. Rather than teaching, a fifth of teachers are spending more than an hour a day responding to behaviour.
Managing classroom behaviours is taking large amounts of teachers’ time that could be spent on teaching. One-fifth of teachers (21 percent) spend more than an hour a day responding to classroom behaviour.
Figure 35: Average time teachers and principals spend daily responding to behaviour
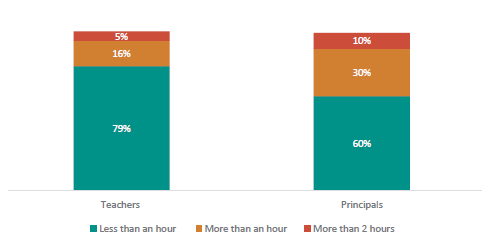
We heard students are concerned about missing out on learning due to behaviours occurring in the classroom, particularly the impact on preparation for secondary exams.
“It could impact us pretty badly… especially around this time. Like for the seniors, especially when we're trying to learn as much as we can for our externals and all that. So, if we miss one like bit of information, that may decide if we get a pass or not a pass.” (Student)
We heard this same concern from parents and whānau with some sharing they had organised external learning support for their child when their classroom progress had been impacted by other students’ behaviour.
“My son, there were children in [his class] with a few difficulties and… that was very distracting… especially for him… And we found that we ended up having to get a tutor for him outside of school and pay for that for a couple of years to get him up to scratch.” (Parent)
b) Student enjoyment at school
Students’ enjoyment is impacted by classroom behaviours, and two-thirds of teachers report a large impact on their students’ enjoyment.
About two-thirds of teachers (68 percent) and principals (63 percent) see that challenging behaviour in the classroom has a large or very large impact on student enjoyment.
We heard from teachers about the challenge of balancing their time and interactions among students in their class, with teachers not being able to give those students who are ‘doing the right thing’ the attention ‘they deserve’.
“For the children who are just doing the right thing all the time… you feel like you really want to give them that attention, but you're one person out of so many… Sometimes when it can get away from you, you're like, ‘Oh, you feel like you've given this one kid so much and the others not as much’. So it's just that balance of how to do that.” (Teacher)
We also heard that students are annoyed by other students distracting them from work they are trying to do.
“Some kids in my class were not doing their work and being silly and it annoyed me because they were sitting at my desk and they were getting me distracted.” (Student)
2) What is the impact on teachers and principals?
This section sets out what we know about the impacts on the teachers and principals, including:
- difficulties teachers face
- difficulties principals face.
a) Difficulties teachers face
Managing classroom behaviour takes a large toll on more than half of teachers’ wellbeing.
Three out of five teachers find that behaviour has a large or very large impact on their stress (60 percent) and over half say it has a large or very large impact on their mental health (53 percent). Principals agreed, as four out of five (82 percent) see that student behaviour has a large or very large impact on their staff’s stress.
Figure 36: Impact on teachers’ wellbeing reported by teachers themselves and principals
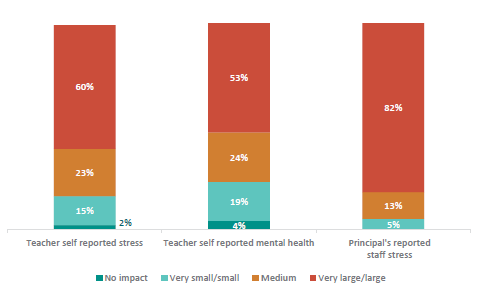
In staff focus groups we heard about the impact of challenging classroom behaviours on staff/teacher wellbeing. Many teachers experience low morale due to frustration and exhaustion dealing with classroom behaviours, along with stress. When staff are under stress it can limit their ability to engage, be proactive, and implement effective behaviour management strategies. We also heard about staff being tired dealing with demanding students.
“I see teachers more stressed than I've seen them before, and I think when people are in that stress situation, they revert to quite old mental models of control and ‘Do it because I say so’ kind of stuff, which we know isn't the way to be relational or focused on the learning… I've seen some quite distressing kind of exchanges between teachers and students over quite ostensibly small things, which escalate really quickly.” (Resource teacher)
“I think it certainly takes its toll on teacher morale. I think there's a level of frustration for teachers that they are here because they want to do absolutely the best by their students… and they question their practice all the time.” (Principal)
Teachers’ physical health is also impacted
Over a quarter of teachers (28 percent) report that managing behaviour has a large or very large impact on their physical health.
“It can get quite tiring when you know you've got eight children out of 27 that are very demanding and act out in class. It can be quite tiring.” (Teacher)
Despite the stress, many teachers are coping
Despite the impacts on their own wellbeing, half of teachers (50 percent) are coping well or very well, and two-thirds (67 percent) feel confidence or very confident in their ability to manage classroom behaviours.
Figure 37: How well teachers are coping to manage behaviour
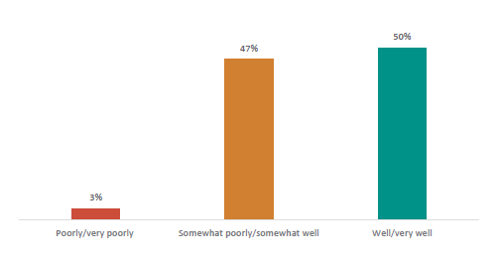
Classroom behaviour is impacting half of teachers’ intentions to stay in the profession.
Two-thirds of teachers (65 percent) report that dealing with classroom behaviour has a large or very large impact on their enjoyment of the job and half (50 percent) find it has a large or very large impact on their intention to stay in the profession. If teachers leave the profession, it means a higher proportion of teachers will be newer to the profession and there will be fewer teachers with experienced in dealing with challenging behaviour.
Figure 38: Impact of behaviour on teachers' enjoyment of the job and intention to stay in profession
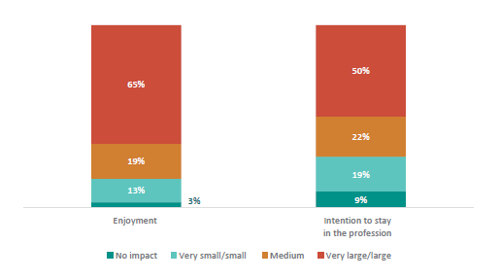
We heard about how stress can lead to staff sickness and high staff turnover. This has a number of flow-on effects at the classroom level with regards to consistency for students when teachers are changing. We also heard classroom behaviours are impacting teachers’ enjoyment, as they are getting worn out dealing with constant behaviour problems. There is also a lot of frustration caused by needing to cater to too many needs with not enough resources.
“That the next step to that with stress… [and] teachers being very tired, is that then you have high staff turnover and staff sickness, and then that leads to inconsistency for the students and a lack of sustainability, because if you've trained your staff in PB4L and then there's high staff turnover, it's hard to maintain that same shared language.” (Resource teacher)
“From the teaching and our side, it is really draining and exhausting because there's three of us on the ground, four of us sometimes on the ground, and we're on the ground and in the classrooms and constantly putting out fires. And it does it wears you down and it is exhausting.” (Learning Support Coordinator)
“The pressure on the classroom teacher and the number of cognitive, social and emotional needs that they have to cater for is really not doable. It's not achievable. And the number of referrals… has also skyrocketed in the last ten years. So therefore, there's a workload paperwork process… one's pushing up against the other. The teacher's pushing up against the SENCo. The SENCo is pushing whatever. And when things don't happen, that causes frustration.” (Principal)
b) Difficulties principals face
Two fifths of principals spend more than an hour a day responding to behaviour, and this is causing them stress.
Principalship in Aotearoa New Zealand is a complex role encompassing a range of educational, managerial, administrative, and cultural leadership responsibilities.(50) Given the complex nature of the role, having time to carry out the many responsibilities is crucial, yet large amounts of time are being taken up by dealing with behavioural issues within the school.
Two fifths (40 percent) of principals spend more than an hour a day responding to behaviour. In dealing with behaviour at school, over half of principals experience a large or very large impact on their stress (59 percent) and enjoyment of the job (58 percent).
In focus groups we heard that principals are worried about their staff who are exhausted, and they are also experiencing frustrated parents who don’t think enough is being done for their students.
“And then that you have that notion of blame. So the blame game is, again, parents criticising schools, parents criticising teachers, headmasters, DPs [deputy principals], everything that has also got fundamentally worse because of what? Because of the pressure that those individuals and groups are under.” (Principal)
Figure 39: Principals’ reported impact on their stress and enjoyment
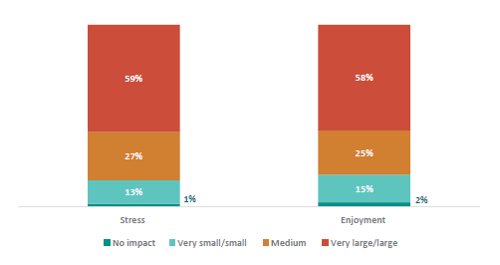
3) How does the impact look across different schools?
This section sets out what we know about the impacts of behaviour, when looking across different contexts, including:
- school age group
- school size
- schools in high and low socioeconomic communities
- teachers’ gender
- teachers’ experience
a) School age group
While student enjoyment is impacted across all types of schools, it is impacted less at primary school.
Despite teachers needing to spend more time addressing classroom behaviours in primary schools and a greater impact on teacher wellbeing, student enjoyment of learning is impacted less in primary school. Sixty-three percent of primary school teachers see a large or very large impact of behaviours on student enjoyment, compared to seven out of 10 intermediate (70 percent) and secondary school teachers (71 percent).
Figure 40: Percentage of teachers reporting student enjoyment is impacted to a large/very large extent by school age group
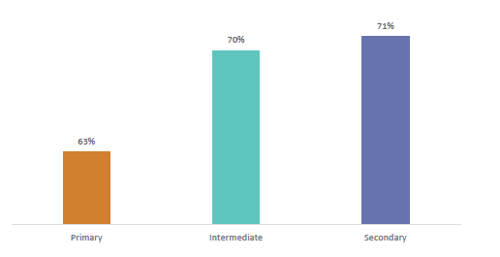
At secondary school we found behaviours that distract from learning are more prevalent and getting worse more often compared with primary. We know from previous research (51) that secondary students tend to be more concerned about their learning progress than younger students and this concern about progress paired with complexity of learning tasks increases at secondary schools will be impacting their enjoyment more.
While students’ progress is impacted across all schools, it is less impacted at intermediate school.
Teachers in intermediate schools tend to report that classroom behaviours impact on their students’ progress less (65 percent reporting a large or very impact) than teachers in primary (71 percent) or secondary schools (77 percent). This is independent of the school size.
Figure 41: Percentage of teachers reporting student progress is impacted to a large/very large extent by school age group
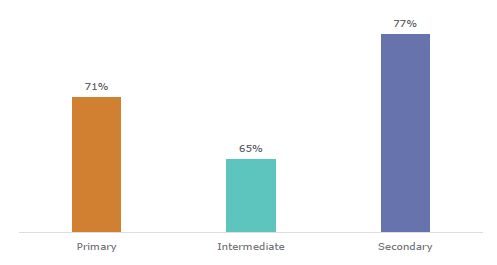
The students at intermediate may be impacted less because intermediate teachers are less impacted, are coping better, and are more confident to manage challenging behaviour (this is outlined later in the report). In focus groups with intermediate school staff, we heard that intermediate schools are distinctive in that, unlike other types of schools, they only have students from two year levels. This means that they can really tailor the way the school runs and its set-up, to suit the needs of students at the developmental stage of Year 7 and 8.
“We understand our adolescents and how an environment needs to look and sound and feel to best help their development and their relationships.” (Intermediate school team leader)
Teachers at primary school are spending more time responding to behaviour.
Primary school teachers are spending more time responding to classroom behaviours than teachers in secondary schools, with just 11 percent of primary school teachers spending less than 10 minutes per day responding to classroom behaviours as opposed to 17 percent of secondary school teachers.
There is a bigger impact on primary school teachers’ stress, mental health, and physical health.
Primary school teachers more often report a large or very large impact on their stress (67 percent) compared to secondary teachers (56 percent). Primary teachers are also more likely to experience a large or very large impact on their mental health (57 percent compared to 50 percent of secondary school teachers) and on their physical health (33 percent compared to 25 percent of secondary school teachers).
The differences in how primary schools are set up compared to secondary schools will be why primary teachers are feeling more impacted. Secondary schools typically have different teachers for different subjects and students move around classes throughout the day, where-as primary teachers typically have the same students for the whole day, every day.
Figure 42: Percentage of teachers reporting a very large/large impact on their wellbeing by school type
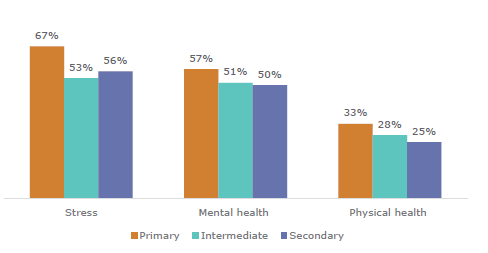
Teachers at intermediate schools are less impacted, are coping better, and are more confident in managing challenging behaviour.
Nearly two-thirds of teachers at intermediate schools (64 percent) report that they are coping well or very well with managing classroom behaviours compared to half of primary (49 percent) and secondary school teachers (49 percent). Additionally, three-quarters (74 percent) of teachers in intermediate schools are confident or very confident in managing classroom behaviours, more than teachers in primary (64 percent) or secondary schools (69 percent).
As described above, the unique setting of intermediate schools with only two year levels allows them to tailor their school set-up to suit the developmental stage of their students. In addition, it may also be that teachers at intermediate schools become specialised in how to deal with behaviours that this age group tend to display. So over time, intermediate teachers might be better equipped to cope with behaviour they are faced with.
Figure 43: How well teachers are coping and their confidence by school age group
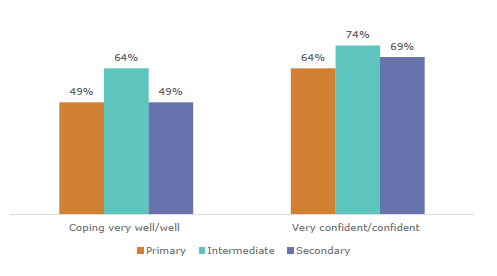
b) School size
Principals at large schools spend more time responding to behaviour.
Principals of larger schools spend more time responding to challenging behaviour, with 26 percent of principals in larger schools spending more than 1.5 hours per day compared to just 12 percent of principals at smaller schools.
Figure 44: Percentage of principals spending more than 1.5 hours a day responding to behaviour by school size
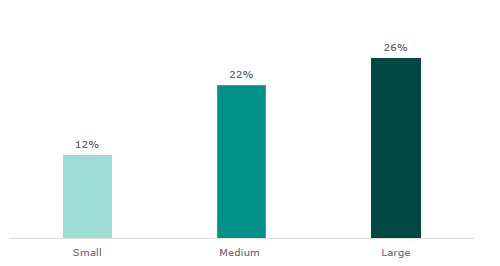
Large schools have a greater number of students and therefore are more likely to have a greater number of students displaying behaviour problems. As there is still only one principal no matter the size of the school, it makes sense that in larger schools the principal will spend more time responding to behaviour. This will be working alongside the greater sense of community that smaller schools have.
c) Schools in high and low socioeconomic communities
Teachers and principals at schools in low socioeconomic communities are spending more time responding to behaviours and student progress and enjoyment is more impacted.
Twenty-seven percent of teachers in schools in low socioeconomic communities are spending more than an hour a day responding to behaviours, compared to 18 percent of teachers in schools in high socioeconomic communities. Half (48 percent) of principals from schools in low socioeconomic communities spend more than an hour a day responding to behaviours compared to one-third (32 percent) of principals from schools in high socioeconomic communities.
Student progress is more impacted in schools in low socioeconomic communities. Three-quarters (78 percent) of teachers and principals from schools in low socioeconomic communities report that classroom behaviours have a large or very large impact on their students’ progress, compared to two-thirds (67 percent) of teachers and half of principals (51 percent) in schools in high socioeconomic communities.
Figure 45: Teachers and principals reporting student progress is impacted to a very large/large extent by socioeconomic status
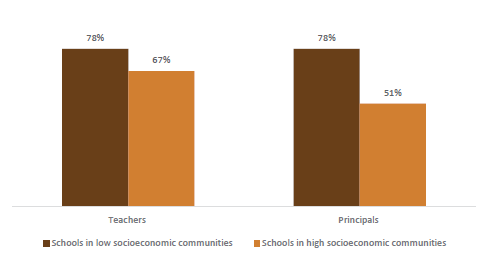
Similarly, around three-quarters of teachers (73 percent) and principals (76 percent) in schools in low socioeconomic communities report a large or very large impact on student enjoyment of learning, compared to just over half of teachers (58 percent) and principals (55 percent) from schools in high socioeconomic communities.
There are a lot of additional challenges that schools in low socioeconomic communities face. We found that challenging behaviour across all behaviour categories is happening more frequently at schools in low socioeconomic communities, so these schools are spending more time responding to behaviours and student progress and enjoyment is also more impacted.
d) Teachers’ gender
Classroom behaviours have more impact on the stress of female teachers and female principals.
Two-thirds (65 percent) of female teachers experience a large or very large impact on their stress compared to just under half of male teachers (46 percent). The same is experienced by female principals (62 percent female compared to 53 percent of male principals).
Figure 46: Teachers reporting behaviour has a very large/large impact on their stress by gender
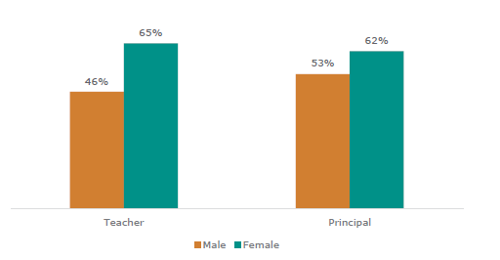
We found that female teachers report across all behaviour categories that behaviour is becoming worse more often than males. We also know from previous work that females tend to think their workload is less manageable(52), so these combined factors may be why they are more impacted.
e) Teachers’ experience
Teachers with six to nine years’ experience are more impacted.
Seven out of 10 (69 percent) of teachers with six to nine years’ experience report a large or very large impact on their stress, compared with 62 percent of those with less than five years’ experience and 58 percent of those with 10 or more years’ experience.
Seven out of 10 (71 percent) teachers with six to nine years’ experience report a large or very large impact on their enjoyment of the job, compared with 58 percent of those with less than five years’ experience and 65 percent of those with 10 or more years’ experience.
Figure 47: Teachers reporting very large/large impacts on their stress and enjoyment by experience
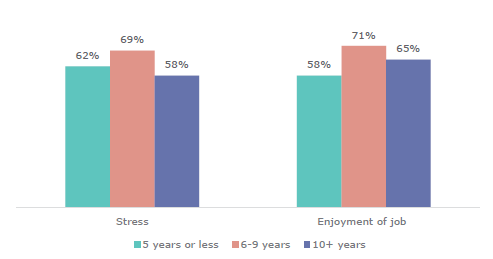
Three-quarters (74 percent) of teachers with six to nine years’ experience report large or very large impacts on students’ enjoyment compared with 65 percent of those with less than five years’ experience and 67 percent of those with 10 or more years’ experience.
Those with six to nine years’ experience don’t have as much knowledge and practice as those who have been in the profession for 10 or more years, but they are also not as new and as optimistic as some newer teachers. This would lead to those with six to nine years’ experience being the most burned-out when it comes to behaviour.
f) Rurality
Teachers at main urban schools are struggling with behaviour more than teachers in rural schools.
Just half (50 percent) of teachers in main urban schools are coping well or very well with behaviour, compared to nearly two-thirds (62 percent) of teachers in rural schools.
Rural schools tend to have a stronger sense of community. This could enable teachers at rural schools to feel they can cope with the behaviour they face in the classroom compared to schools in main urban areas.
Conclusion
Students’ progress and enjoyment at school is significantly affected by the classroom environment. Many school staff and students are concerned about the impact of classroom behaviours on students’ learning. On top of this, large amounts of time are being taken away from teaching in order to respond to challenging behaviour within the classroom. This time is valuable and would be better spent on teaching.
Teachers face large difficulties when it comes to classroom behaviour and this impacts on their likelihood to stay in the profession, mental health, physical health, and stress. We also heard teachers’ concerns about feeling as though they could not provide students who are showing positive behaviour and engagement with enough attention. Despite the impacts on their own wellbeing, half of teachers are coping well, and many feel confident in their own ability to manage classroom behaviours.
Principals are also spending large amounts of time responding to behaviour and, as a result, over half are experiencing large impacts on their stress and enjoyment of the job.
Challenging behaviours in the classroom have a large impact on the experience of students, teachers, and principals. They impact on students’ ability to engage with lessons, the progress they make, and their enjoyment of school. For teachers, dealing with challenging behaviours consumes too much classroom time, takes a large toll on their wellbeing, and for many, impacts their desire to stay in the profession. Principals also spend large amounts of their time dealing with challenging behaviours, causing them stress.
We know that challenging behaviours are occurring in classrooms across Aotearoa New Zealand every day. As teachers’ and students’ time is limited, time spent managing and responding to behaviour takes away from learning. There are a number of impacts that behaviour in the classroom has on students.
To understand the impact of classroom behaviours on students, parents and whānau, teachers, and principals we looked at:
- international and local evidence about engagement and attainment
- our surveys of teachers and principals
- our interviews with teachers, leaders, parents and whānau.
This section sets out the impact on students, parents and whānau, teachers, and principals. It covers:
- what the impact is on other students
- what the impact on teachers and principals is
- how the impact looks across different schools.
What we found: An overview
Students’ learning and progress is highly impacted by classroom behaviours. One fifth of teachers (21 percent) and two fifths of principals (40 percent) spend more than an hour a day responding to classroom behaviour. Most teachers see this impact on students’ learning and progress. We also heard that secondary students are particularly worried about the impact on their preparation for exams.
Students’ enjoyment is impacted. About two-thirds of teachers (68 percent) and principals (63 percent) find that challenging behaviour in the classroom has a large impact on student enjoyment.
Classroom behaviour is impacting the likelihood of teachers staying in the profession. Teachers experience large impacts on their wellbeing through mental health, physical health, and stress. Half of teachers (50 percent) say this has a large impact on their intention to stay in the profession.
Principals are also facing difficulties. Over half of principals report poor student behaviour has a large impact on their stress (59 percent) and enjoyment of the job (58 percent).
1) What is the impact on other students?
This section sets out what we know about the impacts on other students, including:
- learning and progress
- enjoyment at school.
Classroom behaviours have a large impact on students, shaping their academic performance, emotional wellbeing, and enjoyment of learning. A positive and well-managed classroom environment can enhance students’ engagement, motivation, experience of school, and their achievement.
a) Student learning and progress
Students’ progress is highly impacted by classroom behaviours, with three-quarters of teachers reporting large concerns about their students’ progress.
Most school staff are concerned about the impact of classroom behaviours on the progress of their students with three-quarters of teachers (74 percent) and just under two-thirds of principals (63 percent) saying that responding to challenging behaviour in the classroom impacts students’ progress to a large or very large extent.
Figure 34: Teacher and principal perceived impact on student progress
International evidence (PISA) also found the link between behaviour and achievement. They found students in the most well-behaved maths classes scored significantly higher (mean maths score of 512) than all other students, and students in the worst-behaved classes scored the lowest (mean maths score of 468, a difference of 44).(49)
We heard staff and students are concerned about teachers focusing on managing students’ behaviour rather than on teaching. They expressed concern about students’ learning being disrupted and students becoming distracted.
“[When students] become frustrated… they'll often disrupt the learning for others as well.” (Primary school principal)
“My biggest concern is not so much for me but for the children who have to hear [the behaviours] and get drawn into it… Their learning gets disrupted all the time. You're having to stop to address that issue, the other children get distracted… and it's just… a big snowball effect. You feel bad as a teacher that you're not giving the children who are always doing the right thing the attention they should be getting.” (Teacher)
“It's kind of distracting because when other people get told off, everyone just looks in that direction and doesn't focus on the work.” (Student)
Behaviour management is taking large amounts of time. Rather than teaching, a fifth of teachers are spending more than an hour a day responding to behaviour.
Managing classroom behaviours is taking large amounts of teachers’ time that could be spent on teaching. One-fifth of teachers (21 percent) spend more than an hour a day responding to classroom behaviour.
Figure 35: Average time teachers and principals spend daily responding to behaviour
We heard students are concerned about missing out on learning due to behaviours occurring in the classroom, particularly the impact on preparation for secondary exams.
“It could impact us pretty badly… especially around this time. Like for the seniors, especially when we're trying to learn as much as we can for our externals and all that. So, if we miss one like bit of information, that may decide if we get a pass or not a pass.” (Student)
We heard this same concern from parents and whānau with some sharing they had organised external learning support for their child when their classroom progress had been impacted by other students’ behaviour.
“My son, there were children in [his class] with a few difficulties and… that was very distracting… especially for him… And we found that we ended up having to get a tutor for him outside of school and pay for that for a couple of years to get him up to scratch.” (Parent)
b) Student enjoyment at school
Students’ enjoyment is impacted by classroom behaviours, and two-thirds of teachers report a large impact on their students’ enjoyment.
About two-thirds of teachers (68 percent) and principals (63 percent) see that challenging behaviour in the classroom has a large or very large impact on student enjoyment.
We heard from teachers about the challenge of balancing their time and interactions among students in their class, with teachers not being able to give those students who are ‘doing the right thing’ the attention ‘they deserve’.
“For the children who are just doing the right thing all the time… you feel like you really want to give them that attention, but you're one person out of so many… Sometimes when it can get away from you, you're like, ‘Oh, you feel like you've given this one kid so much and the others not as much’. So it's just that balance of how to do that.” (Teacher)
We also heard that students are annoyed by other students distracting them from work they are trying to do.
“Some kids in my class were not doing their work and being silly and it annoyed me because they were sitting at my desk and they were getting me distracted.” (Student)
2) What is the impact on teachers and principals?
This section sets out what we know about the impacts on the teachers and principals, including:
- difficulties teachers face
- difficulties principals face.
a) Difficulties teachers face
Managing classroom behaviour takes a large toll on more than half of teachers’ wellbeing.
Three out of five teachers find that behaviour has a large or very large impact on their stress (60 percent) and over half say it has a large or very large impact on their mental health (53 percent). Principals agreed, as four out of five (82 percent) see that student behaviour has a large or very large impact on their staff’s stress.
Figure 36: Impact on teachers’ wellbeing reported by teachers themselves and principals
In staff focus groups we heard about the impact of challenging classroom behaviours on staff/teacher wellbeing. Many teachers experience low morale due to frustration and exhaustion dealing with classroom behaviours, along with stress. When staff are under stress it can limit their ability to engage, be proactive, and implement effective behaviour management strategies. We also heard about staff being tired dealing with demanding students.
“I see teachers more stressed than I've seen them before, and I think when people are in that stress situation, they revert to quite old mental models of control and ‘Do it because I say so’ kind of stuff, which we know isn't the way to be relational or focused on the learning… I've seen some quite distressing kind of exchanges between teachers and students over quite ostensibly small things, which escalate really quickly.” (Resource teacher)
“I think it certainly takes its toll on teacher morale. I think there's a level of frustration for teachers that they are here because they want to do absolutely the best by their students… and they question their practice all the time.” (Principal)
Teachers’ physical health is also impacted
Over a quarter of teachers (28 percent) report that managing behaviour has a large or very large impact on their physical health.
“It can get quite tiring when you know you've got eight children out of 27 that are very demanding and act out in class. It can be quite tiring.” (Teacher)
Despite the stress, many teachers are coping
Despite the impacts on their own wellbeing, half of teachers (50 percent) are coping well or very well, and two-thirds (67 percent) feel confidence or very confident in their ability to manage classroom behaviours.
Figure 37: How well teachers are coping to manage behaviour
Classroom behaviour is impacting half of teachers’ intentions to stay in the profession.
Two-thirds of teachers (65 percent) report that dealing with classroom behaviour has a large or very large impact on their enjoyment of the job and half (50 percent) find it has a large or very large impact on their intention to stay in the profession. If teachers leave the profession, it means a higher proportion of teachers will be newer to the profession and there will be fewer teachers with experienced in dealing with challenging behaviour.
Figure 38: Impact of behaviour on teachers' enjoyment of the job and intention to stay in profession
We heard about how stress can lead to staff sickness and high staff turnover. This has a number of flow-on effects at the classroom level with regards to consistency for students when teachers are changing. We also heard classroom behaviours are impacting teachers’ enjoyment, as they are getting worn out dealing with constant behaviour problems. There is also a lot of frustration caused by needing to cater to too many needs with not enough resources.
“That the next step to that with stress… [and] teachers being very tired, is that then you have high staff turnover and staff sickness, and then that leads to inconsistency for the students and a lack of sustainability, because if you've trained your staff in PB4L and then there's high staff turnover, it's hard to maintain that same shared language.” (Resource teacher)
“From the teaching and our side, it is really draining and exhausting because there's three of us on the ground, four of us sometimes on the ground, and we're on the ground and in the classrooms and constantly putting out fires. And it does it wears you down and it is exhausting.” (Learning Support Coordinator)
“The pressure on the classroom teacher and the number of cognitive, social and emotional needs that they have to cater for is really not doable. It's not achievable. And the number of referrals… has also skyrocketed in the last ten years. So therefore, there's a workload paperwork process… one's pushing up against the other. The teacher's pushing up against the SENCo. The SENCo is pushing whatever. And when things don't happen, that causes frustration.” (Principal)
b) Difficulties principals face
Two fifths of principals spend more than an hour a day responding to behaviour, and this is causing them stress.
Principalship in Aotearoa New Zealand is a complex role encompassing a range of educational, managerial, administrative, and cultural leadership responsibilities.(50) Given the complex nature of the role, having time to carry out the many responsibilities is crucial, yet large amounts of time are being taken up by dealing with behavioural issues within the school.
Two fifths (40 percent) of principals spend more than an hour a day responding to behaviour. In dealing with behaviour at school, over half of principals experience a large or very large impact on their stress (59 percent) and enjoyment of the job (58 percent).
In focus groups we heard that principals are worried about their staff who are exhausted, and they are also experiencing frustrated parents who don’t think enough is being done for their students.
“And then that you have that notion of blame. So the blame game is, again, parents criticising schools, parents criticising teachers, headmasters, DPs [deputy principals], everything that has also got fundamentally worse because of what? Because of the pressure that those individuals and groups are under.” (Principal)
Figure 39: Principals’ reported impact on their stress and enjoyment
3) How does the impact look across different schools?
This section sets out what we know about the impacts of behaviour, when looking across different contexts, including:
- school age group
- school size
- schools in high and low socioeconomic communities
- teachers’ gender
- teachers’ experience
a) School age group
While student enjoyment is impacted across all types of schools, it is impacted less at primary school.
Despite teachers needing to spend more time addressing classroom behaviours in primary schools and a greater impact on teacher wellbeing, student enjoyment of learning is impacted less in primary school. Sixty-three percent of primary school teachers see a large or very large impact of behaviours on student enjoyment, compared to seven out of 10 intermediate (70 percent) and secondary school teachers (71 percent).
Figure 40: Percentage of teachers reporting student enjoyment is impacted to a large/very large extent by school age group
At secondary school we found behaviours that distract from learning are more prevalent and getting worse more often compared with primary. We know from previous research (51) that secondary students tend to be more concerned about their learning progress than younger students and this concern about progress paired with complexity of learning tasks increases at secondary schools will be impacting their enjoyment more.
While students’ progress is impacted across all schools, it is less impacted at intermediate school.
Teachers in intermediate schools tend to report that classroom behaviours impact on their students’ progress less (65 percent reporting a large or very impact) than teachers in primary (71 percent) or secondary schools (77 percent). This is independent of the school size.
Figure 41: Percentage of teachers reporting student progress is impacted to a large/very large extent by school age group
The students at intermediate may be impacted less because intermediate teachers are less impacted, are coping better, and are more confident to manage challenging behaviour (this is outlined later in the report). In focus groups with intermediate school staff, we heard that intermediate schools are distinctive in that, unlike other types of schools, they only have students from two year levels. This means that they can really tailor the way the school runs and its set-up, to suit the needs of students at the developmental stage of Year 7 and 8.
“We understand our adolescents and how an environment needs to look and sound and feel to best help their development and their relationships.” (Intermediate school team leader)
Teachers at primary school are spending more time responding to behaviour.
Primary school teachers are spending more time responding to classroom behaviours than teachers in secondary schools, with just 11 percent of primary school teachers spending less than 10 minutes per day responding to classroom behaviours as opposed to 17 percent of secondary school teachers.
There is a bigger impact on primary school teachers’ stress, mental health, and physical health.
Primary school teachers more often report a large or very large impact on their stress (67 percent) compared to secondary teachers (56 percent). Primary teachers are also more likely to experience a large or very large impact on their mental health (57 percent compared to 50 percent of secondary school teachers) and on their physical health (33 percent compared to 25 percent of secondary school teachers).
The differences in how primary schools are set up compared to secondary schools will be why primary teachers are feeling more impacted. Secondary schools typically have different teachers for different subjects and students move around classes throughout the day, where-as primary teachers typically have the same students for the whole day, every day.
Figure 42: Percentage of teachers reporting a very large/large impact on their wellbeing by school type
Teachers at intermediate schools are less impacted, are coping better, and are more confident in managing challenging behaviour.
Nearly two-thirds of teachers at intermediate schools (64 percent) report that they are coping well or very well with managing classroom behaviours compared to half of primary (49 percent) and secondary school teachers (49 percent). Additionally, three-quarters (74 percent) of teachers in intermediate schools are confident or very confident in managing classroom behaviours, more than teachers in primary (64 percent) or secondary schools (69 percent).
As described above, the unique setting of intermediate schools with only two year levels allows them to tailor their school set-up to suit the developmental stage of their students. In addition, it may also be that teachers at intermediate schools become specialised in how to deal with behaviours that this age group tend to display. So over time, intermediate teachers might be better equipped to cope with behaviour they are faced with.
Figure 43: How well teachers are coping and their confidence by school age group
b) School size
Principals at large schools spend more time responding to behaviour.
Principals of larger schools spend more time responding to challenging behaviour, with 26 percent of principals in larger schools spending more than 1.5 hours per day compared to just 12 percent of principals at smaller schools.
Figure 44: Percentage of principals spending more than 1.5 hours a day responding to behaviour by school size
Large schools have a greater number of students and therefore are more likely to have a greater number of students displaying behaviour problems. As there is still only one principal no matter the size of the school, it makes sense that in larger schools the principal will spend more time responding to behaviour. This will be working alongside the greater sense of community that smaller schools have.
c) Schools in high and low socioeconomic communities
Teachers and principals at schools in low socioeconomic communities are spending more time responding to behaviours and student progress and enjoyment is more impacted.
Twenty-seven percent of teachers in schools in low socioeconomic communities are spending more than an hour a day responding to behaviours, compared to 18 percent of teachers in schools in high socioeconomic communities. Half (48 percent) of principals from schools in low socioeconomic communities spend more than an hour a day responding to behaviours compared to one-third (32 percent) of principals from schools in high socioeconomic communities.
Student progress is more impacted in schools in low socioeconomic communities. Three-quarters (78 percent) of teachers and principals from schools in low socioeconomic communities report that classroom behaviours have a large or very large impact on their students’ progress, compared to two-thirds (67 percent) of teachers and half of principals (51 percent) in schools in high socioeconomic communities.
Figure 45: Teachers and principals reporting student progress is impacted to a very large/large extent by socioeconomic status
Similarly, around three-quarters of teachers (73 percent) and principals (76 percent) in schools in low socioeconomic communities report a large or very large impact on student enjoyment of learning, compared to just over half of teachers (58 percent) and principals (55 percent) from schools in high socioeconomic communities.
There are a lot of additional challenges that schools in low socioeconomic communities face. We found that challenging behaviour across all behaviour categories is happening more frequently at schools in low socioeconomic communities, so these schools are spending more time responding to behaviours and student progress and enjoyment is also more impacted.
d) Teachers’ gender
Classroom behaviours have more impact on the stress of female teachers and female principals.
Two-thirds (65 percent) of female teachers experience a large or very large impact on their stress compared to just under half of male teachers (46 percent). The same is experienced by female principals (62 percent female compared to 53 percent of male principals).
Figure 46: Teachers reporting behaviour has a very large/large impact on their stress by gender
We found that female teachers report across all behaviour categories that behaviour is becoming worse more often than males. We also know from previous work that females tend to think their workload is less manageable(52), so these combined factors may be why they are more impacted.
e) Teachers’ experience
Teachers with six to nine years’ experience are more impacted.
Seven out of 10 (69 percent) of teachers with six to nine years’ experience report a large or very large impact on their stress, compared with 62 percent of those with less than five years’ experience and 58 percent of those with 10 or more years’ experience.
Seven out of 10 (71 percent) teachers with six to nine years’ experience report a large or very large impact on their enjoyment of the job, compared with 58 percent of those with less than five years’ experience and 65 percent of those with 10 or more years’ experience.
Figure 47: Teachers reporting very large/large impacts on their stress and enjoyment by experience
Three-quarters (74 percent) of teachers with six to nine years’ experience report large or very large impacts on students’ enjoyment compared with 65 percent of those with less than five years’ experience and 67 percent of those with 10 or more years’ experience.
Those with six to nine years’ experience don’t have as much knowledge and practice as those who have been in the profession for 10 or more years, but they are also not as new and as optimistic as some newer teachers. This would lead to those with six to nine years’ experience being the most burned-out when it comes to behaviour.
f) Rurality
Teachers at main urban schools are struggling with behaviour more than teachers in rural schools.
Just half (50 percent) of teachers in main urban schools are coping well or very well with behaviour, compared to nearly two-thirds (62 percent) of teachers in rural schools.
Rural schools tend to have a stronger sense of community. This could enable teachers at rural schools to feel they can cope with the behaviour they face in the classroom compared to schools in main urban areas.
Conclusion
Students’ progress and enjoyment at school is significantly affected by the classroom environment. Many school staff and students are concerned about the impact of classroom behaviours on students’ learning. On top of this, large amounts of time are being taken away from teaching in order to respond to challenging behaviour within the classroom. This time is valuable and would be better spent on teaching.
Teachers face large difficulties when it comes to classroom behaviour and this impacts on their likelihood to stay in the profession, mental health, physical health, and stress. We also heard teachers’ concerns about feeling as though they could not provide students who are showing positive behaviour and engagement with enough attention. Despite the impacts on their own wellbeing, half of teachers are coping well, and many feel confident in their own ability to manage classroom behaviours.
Principals are also spending large amounts of time responding to behaviour and, as a result, over half are experiencing large impacts on their stress and enjoyment of the job.
Chapter 5: What is the impact on students displaying highly challenging behaviour?
Students who display persistent or highly challenging behaviour not only impact the other students and teachers in their class, but also disrupt their own engagement, learning, and wellbeing. This is especially the case when schools use stand-downs, suspensions, or exclusions.
Students who aren’t able to participate in the classroom because of the behaviours they are displaying are at risk of negative life impacts beyond school. In this section, we explore these longer-term impacts using national statistics, with a deep dive into the outcomes of stand-downs, suspensions, expulsions, and exclusions.
As discussed in Chapter 4, challenging behaviours have a range of causes and influences, many of which are outside students’ control. Mental health concerns, home and parent and whānau contexts, ongoing Covid-19 impacts, and disability or other health and communication issues create real and significant challenges for Aotearoa New Zealand’s young people. We know that one of the ways these challenges manifest is in their classroom behaviour.
While poor behaviours do require correction, it is important to remember underlying causes. Students with more extreme behaviour are often our most vulnerable and have the toughest challenges outside of school. School actions have the potential to support these students with careful planning, decisive actions, and expert help, but they also have the potential to make things worse for students.
Stand-downs, suspensions, expulsions, and exclusions are interventions used as a last resort. Ministry guidance is clear that they should be used only when behaviour is particularly harmful or dangerous.(53) In this chapter, we explore the longer-term outcomes of stand-downs, suspensions, expulsions, and exclusions, showing that these interventions are associated with worrying outcomes long after a students’ school years.
To understand the impact, including long-term outcomes, of classroom behaviours on students who are displaying the challenging behaviour we looked at:
- international and local evidence about engagement and attainment
- Statistics New Zealand’s Integrated Data Infrastructure (IDI) data
- what parents and whānau and teachers told us.
This section sets out what we know about the impacts on students who display challenging behaviour, including:
- who these students are
- what their education outcomes are
- what their life-long outcomes are.
What we found: An overview
Behaviour is associated with negative life outcomes.
Student behaviour is sometimes managed through being stood-down (not allowed to attend school). These students have worse life outcomes. Students with three or more stand-downs are less than a third as likely to leave school with NCEA Level 2 (22 percent) than those with no stand-downs (73 percent).Experiencing stand-downs is linked to other longer-term outcomes such as unemployment, offending, and poor health. The younger a student’s first stand-down, suspension, or exclusion, the more likely they are to receive a benefit, have lower income, have a greater number of admissions to emergency departments, offend, or receive a custodial sentence.
Stand-downs, suspensions, and exclusions are associated with poorer achievement.
Students with three or more stand-downs are less than a third as likely to leave school with NCEA Level 2 (22 percent) than those with no stand-downs (73 percent).
Stand-downs, suspensions, and exclusions are linked to future offending.
Those with one stand-down are over three times more likely to offend at age 20 (18 percent), compared to those with no stand-downs (5.1 percent).
1) Who are these students?
A wide range of students are stood-down, suspended, excluded, and expelled each year.
Students of all ages, ethnicities, genders, and socioeconomic backgrounds display challenging classroom behaviours. In 2022, there were 25,167 stand-down cases affecting 18,681 students, 2,728 suspension cases affecting 2,485 students, and schools excluded 852 students and expelled 98 students.(54)
Students who are Māori, male, or from low socioeconomic communities, are overrepresented in these interventions.
There is a lack of consistency with how these interventions are used and the consequences for same behaviour are different across schools and even within schools.(55)
When controlling for other factors (e.g., school characteristics), statistics data shows that Māori students are more likely than NZ European students to be removed from school.(56_
In 2022, Māori students were stood down, suspended, excluded, and expelled at about twice the rate for NZ European students.
The rates of stand-downs are also much higher for male students and students from schools in low socioeconomic communities.
Students with autism also have significantly higher odds of suspension compared to students without autism, although this is reduced with high-needs education-based funding.(57)
Figure 48: Stand-downs rate per 1000 students by gender 2022
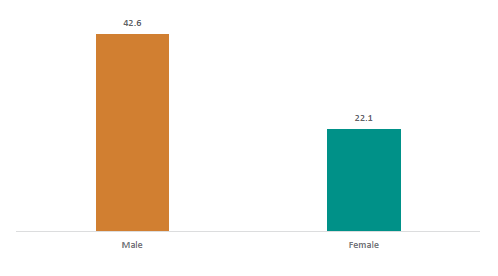
2) What education outcomes do these students have?
Stand-downs, suspensions, and exclusions are linked to poorer achievement.
Students’ achievement gets worse the more stand-downs, suspensions, and exclusions (we refer to these collectively as ‘events’) they have. Going from no events (e.g., never being suspended) to one event makes the most noticeable difference to achievement, but achievement continues to drop the more stand-down, suspension, and exclusion events a student has.
Students with multiple stand-downs, suspensions, or exclusions are less likely to leave school with NCEA achievements.
Stand-downs: Students with three or more stand-downs are less than a third as likely to leave school with NCEA Level 2 (22 percent) than those with no stand-downs (73 percent).
Figure 49: Achievement at age 20 by number of stand-downs
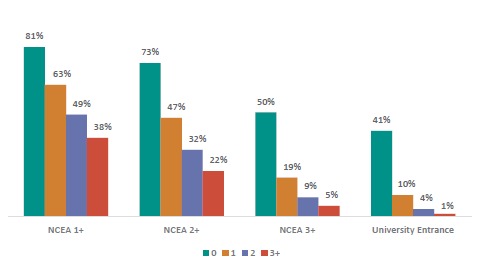
Suspensions: Those with two or more suspensions are less than a third as likely to leave school with NCEA Level 2 (19 percent) than those with no suspensions (70 percent).
Exclusions: Impacts on achievement are even more pronounced for students who have been excluded twice or more. These students are a seventh as likely to leave school with NCEA Level 2 (10 percent) than those with no exclusions (70 percent).
Figure 50: Percentage of students achieving NCEA Level 2 by number of suspensions and exclusions
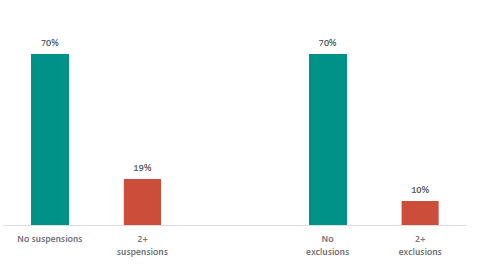
The younger the age of their first stand down, suspension, or exclusion, the worse students’ future achievement is.
Stand-downs: Students who have their first stand-down aged under 11 are less than half as likely to achieve NCEA Level 2 (28 percent) compared to those with no stand-downs (73 percent).
Figure 51: Achievement at age 20 by age of first stand-down
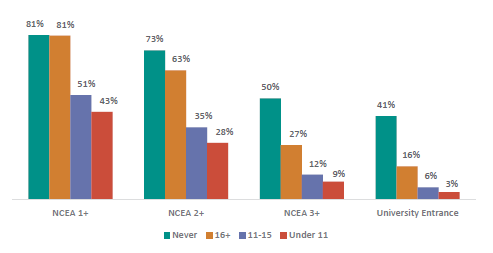
Students who have been stood-down, suspended, or excluded are around half as likely to be enrolled in tertiary education at age 20.
The more stand downs, suspensions, and exclusions a student has, the less likely they are to be enrolled in tertiary education at age 20.
Stand-downs: Those with one stand-down are almost half as likely to be enrolled in tertiary education at age 20 (30 percent) compared to those with no stand-downs (56 percent).
Suspensions and exclusions: Students with one suspension or exclusion are less than half as likely to be enrolled (22 percent) than those with no suspensions or exclusions (53 percent).
Students who have been stood-down at a younger age are less likely to be enrolled in tertiary education at age 20.
Stand-downs: Students with their first stand-down before age 11 are a third as likely to be enrolled in tertiary education at age 20 (19 percent) compared to those with no stand-downs (56 percent). The likelihood of being enrolled in tertiary education increases as the age of a student’s first stand-down increases.
Figure 52: Percentage of people enrolled in tertiary education at 20 by age of first stand-down
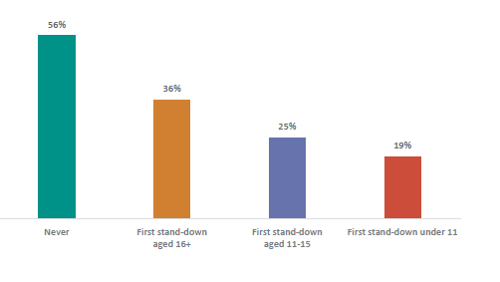
3) What life-long outcomes do these students have?
Stand-downs, suspensions, and exclusions are linked with a range of poorer life-long outcomes, including:
- future employment
- health
- criminal offending.
Poorer outcomes may not be caused by the stand-downs, suspensions, and exclusions, as students who display behaviour issues at school that result in being stood-down often have other challenges in their lives that also contribute to these outcomes. However, stand-downs, suspensions and exclusions are a key indicator of risk of poor life-long outcomes.
a) Future employment
Being stood down, suspended, or excluded (collectively called ‘events’) is linked to poorer employment outcomes later in life, particularly with higher numbers of events, or for students who are a younger when they have their first event.
Students who have had two stand-downs are more than twice as likely to be receiving a benefit at age 20.
The more stand downs, suspensions, and exclusions a student has, the more likely they are to be receive a benefit at 20.
Stand-downs: Those with one stand-down are almost twice as likely to be receive a benefit at age 20 (43 percent) than those with no stand-downs (22 percent). Students who have had two stand-downs are more than twice as likely to be receiving a benefit at age 20 (53 percent compared to 22 percent).
Figure 53: Percentage of people receiving a benefit at age 20 by the number of stand-downs
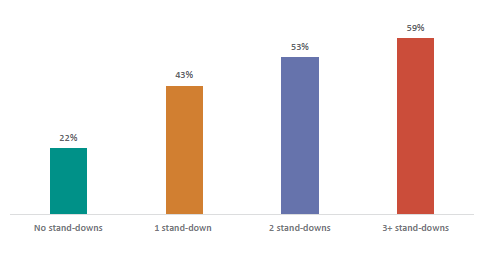
Suspensions: Similarly, those students with one suspension are twice as likely to receive a benefit at age 20 (54 percent) than those with no suspensions (25 percent).
Exclusions: Those with one exclusion are almost two and a half times more likely to receive a benefit (61 percent) than those with no exclusions (25 percent).
The younger the student is when they have their first stand-down, suspension, or exclusion, the more likely they are to receive a benefit at 20.
Stand-downs: Those students who have their first stand-down before the age of 11 are two and a half times more likely to be receive a benefit at age 20 (56 percent) than those with no stand-downs (22 percent).
Figure 54: Percentage of people receiving a benefit at age 20 by age of their first stand-down
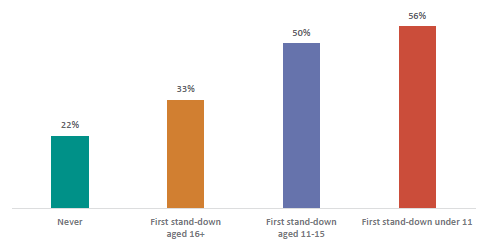
As the number of students’ stand-downs, suspensions, or exclusions increases, their likelihood of being employed at age 20 decreases.
Exclusions: Students with two or more exclusions are 26 percentage points less likely to be employed at age 20 than those with no exclusions (56 percent compared to 82 percent).
Figure 55: Percentage of people employed at age 20 by their number of stand-downs, suspensions, and exclusions
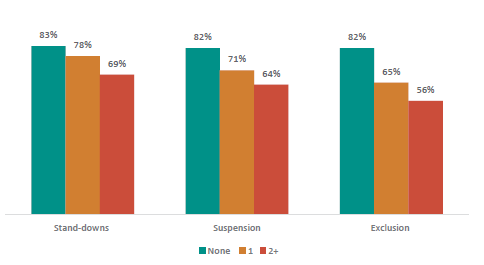
Students who have had three or more stand-downs have $17,000 less income at age 30 than those with no stand-downs.
The more stand-downs, suspensions, and exclusions a person has had at school, the lower their income when they reach age 30.
Stand-downs: Those with one stand-down have around $10,000 lower income annually, those with two stand-downs have $13,000 lower, and those with three or more have $17,000 lower than those with no stand-downs.
Figure 56: Average annual income at age 30 by number of stand-downs
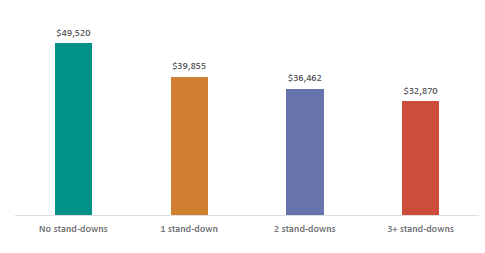
This link is even more pronounced for suspension and exclusion events. Those students who have had two or more exclusions earn $22,000 lower annually than those with no exclusions.
The younger the student is when they first experience a stand-down, suspension, or exclusion, the lower their income at age 30.
Stand-downs: Students with their first stand-down under 11 earn $15,000 less at age 30, those with their first stand-down between 11-15 earn $13,000 less, and those with first stand-down at 16 or older earn $6,000 less than those with no stand-downs.
Suspensions and exclusions: This is again more evident for suspensions and exclusions. Students who are suspended before they are 11 earn about $21,000 less than those with no suspensions, and those with an exclusion before 11 earn $18,000 less than those with no exclusions.
b) Health
The more stand-downs, suspensions, and exclusions a student has, the more average emergency department (ED) admissions they have at 20.
Stand-downs: Students who have had one stand-down have a higher average number of ED admissions (0.45 admission on average) at age 20, than those with no stand-downs (0.27).
Figure 57: Average number of admissions to an ED at 20 by number of stand-downs
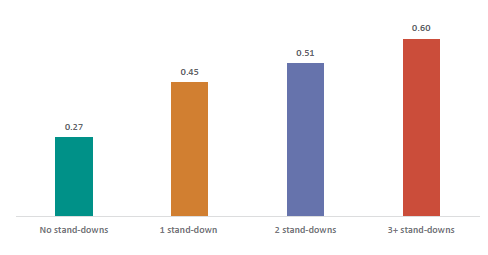
Stand-downs: Those that had their first stand-down before 11, have twice as many ED admissions on average (0.55) at age 20 than those with no stand-downs (0.27).
c) Criminal offending
Those with three or more stand-downs are over 30 times more likely to serve a custodial sentence at 20 than those with no stand-downs.
The more stand-downs, suspensions, and exclusions a student has, the more likely they are to be serving a custodial sentence at age 20.
Stand-downs: Just 0.3 percent of students that have had no stand-downs are serving a custodial sentence at age 20. Those with one stand-down are 8.5 times more likely to be serving a custodial sentence (2.6 percent). Those with two or more stand-downs are 18 times more likely to serve a custodial sentence (5.4 percent), and those with three or more stand-downs are over 30 times more likely to be serving a custodial sentence (10 percent).
Figure 58: Percentage of people serving a custodial sentence at age 20 by the number of stand-downs
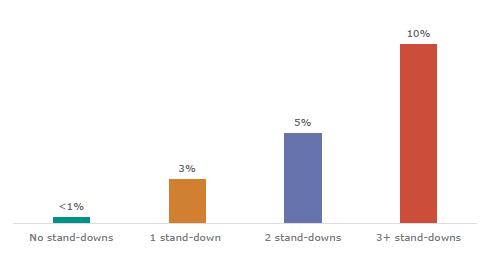
Suspensions and exclusions: This is even more pronounced for those with suspensions or exclusions. Just 0.7 percent of those with no suspensions or exclusions are serving a custodial sentence at 20. The likelihood increases greatly for those with one (7.5 percent) or two or more suspensions (14 percent), and even more so for those with one (12 percent) or two or more exclusions (23 percent).
The younger the student is when they first experience a stand-down, suspension, or exclusion, the more likely they are to be serving a custodial sentence at 20.
Stand-downs: Those with their first stand-down occurring before age 11 are more than 20 times more likely to be serving a custodial sentence at age 20 (13 percent) than those with no stand-downs (0.3 percent). This drops to 4.4 percent if their first stand-down occurred between ages 11-15, and 1.1 percent if the first stand-down occurred when they were 16 or older.
Figure 59: Percentage of people with a custodial sentence at 20 by age of first stand-down
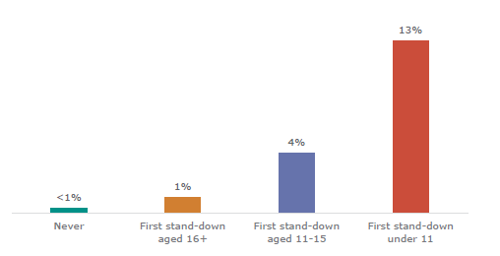
The more stand-downs, suspensions, and exclusions a student has, the more likely they are to offend at age 20.
Stand-downs: Compared to those with no stand-downs (5.1 percent are offenders at age 20), those with one stand-down are over three times more likely to be offenders at 20 (18 percent). Those who were first stood down before the age of 11 are nearly seven times more likely to offend (34 percent).
Conclusion
While there can be large impacts of classroom behaviours to teachers and other students, students with challenging behaviour that results in a stand-down, suspension, or exclusion are also significantly impacted themselves.
There are a number of negative life outcomes associated with experiencing stand-down, suspension, or exclusion events. These include outcomes related to educational achievement, employment, income, health, and criminal offending. The greater number of events, and the younger the student at their first event, the worse these outcomes tend to be.
Stand-downs, suspensions, and exclusions have negative consequences well beyond students’ school years, and are strong indicators of risk for future poorer life outcomes.
Students who display persistent or highly challenging behaviour not only impact the other students and teachers in their class, but also disrupt their own engagement, learning, and wellbeing. This is especially the case when schools use stand-downs, suspensions, or exclusions.
Students who aren’t able to participate in the classroom because of the behaviours they are displaying are at risk of negative life impacts beyond school. In this section, we explore these longer-term impacts using national statistics, with a deep dive into the outcomes of stand-downs, suspensions, expulsions, and exclusions.
As discussed in Chapter 4, challenging behaviours have a range of causes and influences, many of which are outside students’ control. Mental health concerns, home and parent and whānau contexts, ongoing Covid-19 impacts, and disability or other health and communication issues create real and significant challenges for Aotearoa New Zealand’s young people. We know that one of the ways these challenges manifest is in their classroom behaviour.
While poor behaviours do require correction, it is important to remember underlying causes. Students with more extreme behaviour are often our most vulnerable and have the toughest challenges outside of school. School actions have the potential to support these students with careful planning, decisive actions, and expert help, but they also have the potential to make things worse for students.
Stand-downs, suspensions, expulsions, and exclusions are interventions used as a last resort. Ministry guidance is clear that they should be used only when behaviour is particularly harmful or dangerous.(53) In this chapter, we explore the longer-term outcomes of stand-downs, suspensions, expulsions, and exclusions, showing that these interventions are associated with worrying outcomes long after a students’ school years.
To understand the impact, including long-term outcomes, of classroom behaviours on students who are displaying the challenging behaviour we looked at:
- international and local evidence about engagement and attainment
- Statistics New Zealand’s Integrated Data Infrastructure (IDI) data
- what parents and whānau and teachers told us.
This section sets out what we know about the impacts on students who display challenging behaviour, including:
- who these students are
- what their education outcomes are
- what their life-long outcomes are.
What we found: An overview
Behaviour is associated with negative life outcomes.
Student behaviour is sometimes managed through being stood-down (not allowed to attend school). These students have worse life outcomes. Students with three or more stand-downs are less than a third as likely to leave school with NCEA Level 2 (22 percent) than those with no stand-downs (73 percent).Experiencing stand-downs is linked to other longer-term outcomes such as unemployment, offending, and poor health. The younger a student’s first stand-down, suspension, or exclusion, the more likely they are to receive a benefit, have lower income, have a greater number of admissions to emergency departments, offend, or receive a custodial sentence.
Stand-downs, suspensions, and exclusions are associated with poorer achievement.
Students with three or more stand-downs are less than a third as likely to leave school with NCEA Level 2 (22 percent) than those with no stand-downs (73 percent).
Stand-downs, suspensions, and exclusions are linked to future offending.
Those with one stand-down are over three times more likely to offend at age 20 (18 percent), compared to those with no stand-downs (5.1 percent).
1) Who are these students?
A wide range of students are stood-down, suspended, excluded, and expelled each year.
Students of all ages, ethnicities, genders, and socioeconomic backgrounds display challenging classroom behaviours. In 2022, there were 25,167 stand-down cases affecting 18,681 students, 2,728 suspension cases affecting 2,485 students, and schools excluded 852 students and expelled 98 students.(54)
Students who are Māori, male, or from low socioeconomic communities, are overrepresented in these interventions.
There is a lack of consistency with how these interventions are used and the consequences for same behaviour are different across schools and even within schools.(55)
When controlling for other factors (e.g., school characteristics), statistics data shows that Māori students are more likely than NZ European students to be removed from school.(56_
In 2022, Māori students were stood down, suspended, excluded, and expelled at about twice the rate for NZ European students.
The rates of stand-downs are also much higher for male students and students from schools in low socioeconomic communities.
Students with autism also have significantly higher odds of suspension compared to students without autism, although this is reduced with high-needs education-based funding.(57)
Figure 48: Stand-downs rate per 1000 students by gender 2022
2) What education outcomes do these students have?
Stand-downs, suspensions, and exclusions are linked to poorer achievement.
Students’ achievement gets worse the more stand-downs, suspensions, and exclusions (we refer to these collectively as ‘events’) they have. Going from no events (e.g., never being suspended) to one event makes the most noticeable difference to achievement, but achievement continues to drop the more stand-down, suspension, and exclusion events a student has.
Students with multiple stand-downs, suspensions, or exclusions are less likely to leave school with NCEA achievements.
Stand-downs: Students with three or more stand-downs are less than a third as likely to leave school with NCEA Level 2 (22 percent) than those with no stand-downs (73 percent).
Figure 49: Achievement at age 20 by number of stand-downs
Suspensions: Those with two or more suspensions are less than a third as likely to leave school with NCEA Level 2 (19 percent) than those with no suspensions (70 percent).
Exclusions: Impacts on achievement are even more pronounced for students who have been excluded twice or more. These students are a seventh as likely to leave school with NCEA Level 2 (10 percent) than those with no exclusions (70 percent).
Figure 50: Percentage of students achieving NCEA Level 2 by number of suspensions and exclusions
The younger the age of their first stand down, suspension, or exclusion, the worse students’ future achievement is.
Stand-downs: Students who have their first stand-down aged under 11 are less than half as likely to achieve NCEA Level 2 (28 percent) compared to those with no stand-downs (73 percent).
Figure 51: Achievement at age 20 by age of first stand-down
Students who have been stood-down, suspended, or excluded are around half as likely to be enrolled in tertiary education at age 20.
The more stand downs, suspensions, and exclusions a student has, the less likely they are to be enrolled in tertiary education at age 20.
Stand-downs: Those with one stand-down are almost half as likely to be enrolled in tertiary education at age 20 (30 percent) compared to those with no stand-downs (56 percent).
Suspensions and exclusions: Students with one suspension or exclusion are less than half as likely to be enrolled (22 percent) than those with no suspensions or exclusions (53 percent).
Students who have been stood-down at a younger age are less likely to be enrolled in tertiary education at age 20.
Stand-downs: Students with their first stand-down before age 11 are a third as likely to be enrolled in tertiary education at age 20 (19 percent) compared to those with no stand-downs (56 percent). The likelihood of being enrolled in tertiary education increases as the age of a student’s first stand-down increases.
Figure 52: Percentage of people enrolled in tertiary education at 20 by age of first stand-down
3) What life-long outcomes do these students have?
Stand-downs, suspensions, and exclusions are linked with a range of poorer life-long outcomes, including:
- future employment
- health
- criminal offending.
Poorer outcomes may not be caused by the stand-downs, suspensions, and exclusions, as students who display behaviour issues at school that result in being stood-down often have other challenges in their lives that also contribute to these outcomes. However, stand-downs, suspensions and exclusions are a key indicator of risk of poor life-long outcomes.
a) Future employment
Being stood down, suspended, or excluded (collectively called ‘events’) is linked to poorer employment outcomes later in life, particularly with higher numbers of events, or for students who are a younger when they have their first event.
Students who have had two stand-downs are more than twice as likely to be receiving a benefit at age 20.
The more stand downs, suspensions, and exclusions a student has, the more likely they are to be receive a benefit at 20.
Stand-downs: Those with one stand-down are almost twice as likely to be receive a benefit at age 20 (43 percent) than those with no stand-downs (22 percent). Students who have had two stand-downs are more than twice as likely to be receiving a benefit at age 20 (53 percent compared to 22 percent).
Figure 53: Percentage of people receiving a benefit at age 20 by the number of stand-downs
Suspensions: Similarly, those students with one suspension are twice as likely to receive a benefit at age 20 (54 percent) than those with no suspensions (25 percent).
Exclusions: Those with one exclusion are almost two and a half times more likely to receive a benefit (61 percent) than those with no exclusions (25 percent).
The younger the student is when they have their first stand-down, suspension, or exclusion, the more likely they are to receive a benefit at 20.
Stand-downs: Those students who have their first stand-down before the age of 11 are two and a half times more likely to be receive a benefit at age 20 (56 percent) than those with no stand-downs (22 percent).
Figure 54: Percentage of people receiving a benefit at age 20 by age of their first stand-down
As the number of students’ stand-downs, suspensions, or exclusions increases, their likelihood of being employed at age 20 decreases.
Exclusions: Students with two or more exclusions are 26 percentage points less likely to be employed at age 20 than those with no exclusions (56 percent compared to 82 percent).
Figure 55: Percentage of people employed at age 20 by their number of stand-downs, suspensions, and exclusions
Students who have had three or more stand-downs have $17,000 less income at age 30 than those with no stand-downs.
The more stand-downs, suspensions, and exclusions a person has had at school, the lower their income when they reach age 30.
Stand-downs: Those with one stand-down have around $10,000 lower income annually, those with two stand-downs have $13,000 lower, and those with three or more have $17,000 lower than those with no stand-downs.
Figure 56: Average annual income at age 30 by number of stand-downs
This link is even more pronounced for suspension and exclusion events. Those students who have had two or more exclusions earn $22,000 lower annually than those with no exclusions.
The younger the student is when they first experience a stand-down, suspension, or exclusion, the lower their income at age 30.
Stand-downs: Students with their first stand-down under 11 earn $15,000 less at age 30, those with their first stand-down between 11-15 earn $13,000 less, and those with first stand-down at 16 or older earn $6,000 less than those with no stand-downs.
Suspensions and exclusions: This is again more evident for suspensions and exclusions. Students who are suspended before they are 11 earn about $21,000 less than those with no suspensions, and those with an exclusion before 11 earn $18,000 less than those with no exclusions.
b) Health
The more stand-downs, suspensions, and exclusions a student has, the more average emergency department (ED) admissions they have at 20.
Stand-downs: Students who have had one stand-down have a higher average number of ED admissions (0.45 admission on average) at age 20, than those with no stand-downs (0.27).
Figure 57: Average number of admissions to an ED at 20 by number of stand-downs
Stand-downs: Those that had their first stand-down before 11, have twice as many ED admissions on average (0.55) at age 20 than those with no stand-downs (0.27).
c) Criminal offending
Those with three or more stand-downs are over 30 times more likely to serve a custodial sentence at 20 than those with no stand-downs.
The more stand-downs, suspensions, and exclusions a student has, the more likely they are to be serving a custodial sentence at age 20.
Stand-downs: Just 0.3 percent of students that have had no stand-downs are serving a custodial sentence at age 20. Those with one stand-down are 8.5 times more likely to be serving a custodial sentence (2.6 percent). Those with two or more stand-downs are 18 times more likely to serve a custodial sentence (5.4 percent), and those with three or more stand-downs are over 30 times more likely to be serving a custodial sentence (10 percent).
Figure 58: Percentage of people serving a custodial sentence at age 20 by the number of stand-downs
Suspensions and exclusions: This is even more pronounced for those with suspensions or exclusions. Just 0.7 percent of those with no suspensions or exclusions are serving a custodial sentence at 20. The likelihood increases greatly for those with one (7.5 percent) or two or more suspensions (14 percent), and even more so for those with one (12 percent) or two or more exclusions (23 percent).
The younger the student is when they first experience a stand-down, suspension, or exclusion, the more likely they are to be serving a custodial sentence at 20.
Stand-downs: Those with their first stand-down occurring before age 11 are more than 20 times more likely to be serving a custodial sentence at age 20 (13 percent) than those with no stand-downs (0.3 percent). This drops to 4.4 percent if their first stand-down occurred between ages 11-15, and 1.1 percent if the first stand-down occurred when they were 16 or older.
Figure 59: Percentage of people with a custodial sentence at 20 by age of first stand-down
The more stand-downs, suspensions, and exclusions a student has, the more likely they are to offend at age 20.
Stand-downs: Compared to those with no stand-downs (5.1 percent are offenders at age 20), those with one stand-down are over three times more likely to be offenders at 20 (18 percent). Those who were first stood down before the age of 11 are nearly seven times more likely to offend (34 percent).
Conclusion
While there can be large impacts of classroom behaviours to teachers and other students, students with challenging behaviour that results in a stand-down, suspension, or exclusion are also significantly impacted themselves.
There are a number of negative life outcomes associated with experiencing stand-down, suspension, or exclusion events. These include outcomes related to educational achievement, employment, income, health, and criminal offending. The greater number of events, and the younger the student at their first event, the worse these outcomes tend to be.
Stand-downs, suspensions, and exclusions have negative consequences well beyond students’ school years, and are strong indicators of risk for future poorer life outcomes.
Chapter 6: What are the challenges for teachers managing behaviour?
Teachers need the right skills and support to manage classroom behaviours. A supportive environment, effective school policies and procedures, colleagues, and external specialists, allow teachers to prevent and respond to challenging behaviour with confidence.
Many teachers do not feel capable, confident, and supported to manage classroom behaviours. There is also a disconnect between how supported teachers feel and how supported principals believe their teachers are. Staff are limited by the actions they can take, and often struggle to access the support they need.
Having skills and being supported is incredibly important for teachers to be able to effectively manage classroom behaviours. This support is both internal and external to the school, and directly impacts teachers’ ability to manage the classroom behaviours they experience daily. This has impacts on learning for their students.
To understand what prevents teachers from managing behaviour, the support they receive, and the levers available to them, we looked at:
- our surveys of teachers and principals
- our focus groups with teachers, leaders, parents and whānau
- the available supports and resources for behaviour in Aotearoa New Zealand
This section looks at what teachers currently do to manage classroom behaviour, and the types of support that are available. It covers:
- teachers’ capability
- schools’ support for teachers
- support from professional learning and development
- actions teachers and leaders are able to take
- external support
- how support looks across different contexts.
What we found: An overview
Not all teachers are well supported to manage challenging classroom behaviour. More than one in eight teachers (12 percent) feel unsupported or very unsupported to manage challenging behaviour in the classroom. One in seven teachers (14 percent) think their school’s behaviour policies and procedures are ineffective or very ineffective and one in four (25 percent) feel these are not applied consistently at their school.
There is a disconnect between how supported principals think their teachers are and how supported teachers feel. Despite one in eight teachers (12 percent) feeling unsupported or very unsupported to manage challenging behaviour in the classroom, just 2 percent of principals think their staff are unsupported or very unsupported. Only one in 100 of principals (1 percent) think that their school’s behaviour policies and procedures are ineffective or very ineffective, and just 2 percent think they are not applied consistently.
Teachers and principals are limited by the actions they can take. Over half of teachers (53 percent) and principals (60 percent) find it difficult or very difficult to find the time they need to tackle behaviour issues.
Many teachers and principals struggle to access the external help they need. Half of teachers (54 percent) and three-quarters of principals (72 percent) find timely advice from experts, external agencies, and others to be an important or very important support. Yet 39 percent of teachers and half of principals (49 percent) find it difficult or very difficult to access this.
Teachers at secondary school feel the least supported, and that their behavioural policies and procedures are the least effective and applied the least consistently. Teachers in secondary schools feel far less supported to manage behaviour in their classrooms. Just 37 percent of teachers at secondary schools feel supported or very supported, compared to 70 percent of teachers at intermediate and 61 percent at primary schools.
Teachers from schools in low socioeconomic communities feel less supported, and just one in four have confidence in their school’s policies and procedures. Teachers in low socioeconomic communities feel less supported. Just 40 percent of teachers from schools in low socioeconomic communities feel supported or very supported as opposed to 55 percent from schools in high socioeconomic communities.
Additionally, just one-quarter (25 percent) of teachers from schools in low socioeconomic communities think that their school behavioural policies and procedures are effective or very effective, compared to 44 percent from schools in high socioeconomic communities. Additionally, teachers from schools in low socioeconomic communities feel that these behavioural policies and procedures are applied consistently less often (23 percent) than teachers from schools in high socioeconomic communities (36 percent).
1) Teacher capability
Teacher capability is critical for effective behaviour management in the classroom. Capability is crucial for:
- getting to know and understand students
- employing effective strategies in behaviour management
- responding effectively to behaviour
- creating and using targeted approaches.
New teachers aren’t confident to manage classroom behaviour.
In their first term of teaching, under half of new teachers report being capable in managing classroom behaviour (45 percent) and over one-third (35 percent) report they are not capable. After two years, 86 percent report being capable, but 5 percent still report not being capable in managing classroom behaviour. This is one of the areas they are the least prepared for when they start.(58)
Figure 60: Teachers’ confidence to manage classroom behaviour in their first term and after two years of teaching.
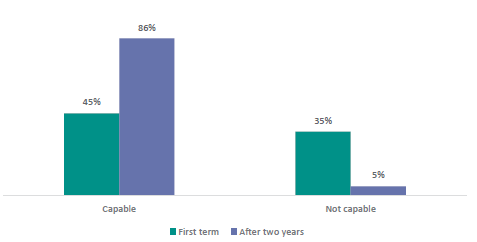
Older new teachers (aged 36 and above) are more prepared to manage behaviour in their first term teaching than teachers aged 35 or younger.
Despite connecting with parents and whānau being a key part of successful behaviour approaches, many new teachers struggle to do this.
Involving parents and whānau in the creation and ongoing use of behavioural expectations within the school is an important part of successful behavioural approaches in schools. We heard in focus groups that parents and whānau feel disconnected from the school when it comes to expectations and approaches for students’ behaviour in class, sometimes due to behavioural expectations or responses being different between home and school.
In their first term of teaching, just half (48 percent) of new teachers report being capable in working with parents, and over one-quarter (27 percent) report not being capable. This is the second weakest area in terms of how capable they feel in their first term. After two years, 87 percent report being capable working with parents and just 4 percent report not being capable.(59)
Parents and whānau also talked about having trust in school staff and knowing the school’s lines of communication when an issue arose with their child’s behaviour - from the teacher through to the principal.
“Through our [policy] review… [we're] continually reviewing them and strengthening them. So we're pleased that they are best practice, in our view. And we're constantly going to… make sure that we follow process when it gets tricky. We just have to follow procedure and process… It's about having that stuff on your website, being transparent about it, and always getting it out and using it.” (Principal)
2) Schools’ support for teachers
Schools’ support for teachers is important for teachers managing challenging classroom behaviours as it provides teachers with policies and procedures they can use and refer to in behaviour management and expectation setting. Support with school staff through collegial support, planning responses to behaviour in teams, and sharing strategies and ideas can increase the confidence and provide ideas to teachers on how best to manage behaviour in the classroom. Strong school support is particularly important in allowing teachers to:
- use a consistent approach to prevent and manage challenging behaviour
- use targeted approaches to meet the individual needs of students.
Not all teachers are supported to manage challenging classroom behaviour.
While almost half of teachers do feel supported to manage challenging behaviour in the classroom, there is still a substantial group who do not feel supported. One in eight teachers (12 percent) feel unsupported or very unsupported to manage challenging behaviour in the classroom.
Figure 61: How supported teachers are to manage challenging behaviour
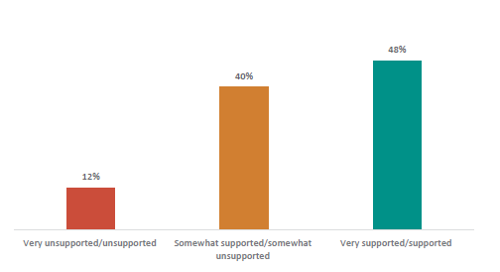
Effective policies and consistent application are important to enable teachers to successfully manage behaviour. While many teachers think their policies and procedures are working at their school, one in seven teachers (14 percent) think that their school’s behaviour policies and procedures are ineffective or very ineffective, and one in four (25 percent) feel that these are not applied consistently at their school.
In focus groups we heard about the importance of staff support for managing behaviour. One common theme is about how important the team approach to solving problems is and how this helps staff to feel supported when dealing with behaviour issues.
“I think we’re really lucky. We’ve got a really supportive management team. Like if we have issues, we’re able to go and talk through it and then they might come in and try to help… like we can sort it out.” (Teacher)
“We actually brainstorm as a staff [on] strategies for how we could get better behaviour from those children… which is quite good. You’re not feeling isolated. If you’ve got a child, you’re getting the whole team working together to support.” (Teacher)
There is a disconnect between how supported principals think their staff are and how supported staff feel.
It is important that the entire school is on the same page when it comes to policies and procedures surrounding behaviours. Despite one in eight teachers (12 percent) feeling unsupported or very unsupported to manage challenging behaviour in the classroom, just 2 percent of principals think their staff are unsupported or very unsupported. In addition, despite one in seven teachers (14 percent) thinking their school’s behaviour policies and procedures are ineffective or very ineffective, only one in 100 principals (1 percent) report this. Similarly, one in four teachers think school behaviour policies are not applied consistently, a view shared by only one in 50 (2 percent) principals.
Figure 62: Principals and teachers reporting that their behaviour policies and procedures are ineffective and not applied consistently
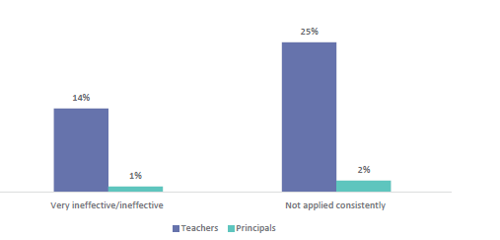
In focus groups we heard staff talk about the importance of transparency, including reviewing behaviour policies and procedures and having these on the school’s website.
Supports that teachers and principals can use
There are a number of ways that teachers and principals can be supported to manage behaviour at their school. Below we set out the how important and accessible different types of supports are for teachers and principals.
Table 3: Summary of how important teachers and principals find each support, ordered by teachers’ ratings
|
|
Percent of teachers reporting supports as very important/important |
Percent of principals reporting supports as very important/important |
|
Time to tackle behaviour issues
|
80% |
94% |
|
Specialist support from external agencies
|
65% |
74% |
|
Legislation guidelines and rules
|
59% |
54% |
|
Behaviour support programmes
|
58% |
71% |
|
Timely advice from experts
|
54% |
72% |
|
Professional learning and development
|
53% |
80% |
Table 4: Summary of how difficult teachers and principals find each support to access, ordered by teachers’ ratings
|
|
Percent of teachers who report support as very difficult/difficult to access |
Percent of principals who report support as very difficult/difficult to access |
|
Time to tackle behaviour issues
|
53%
|
60% |
|
Timely advice from experts
|
39% |
49% |
|
Specialist support from external agencies
|
34% |
44% |
|
Professional learning and development
|
20% |
22% |
|
Behaviour support programmes
|
15% |
6% |
|
Legislation guidelines and rules
|
13% |
4% |
3) Support from professional learning and development
Support from evidenced based professional learning and development (PLD) can be beneficial for teachers in being able to manage challenging behaviour proactively and reactively, as well as gaining a greater understanding of the influences and personal factors contributing to the way that students behave. Depending on the type of PLD accessed, benefits can be seen across all areas of practice.
Professional learning and development is the most important external support to principals but the least important external support to teachers.
Professional learning and development for managing challenging behaviour may include teaching around understanding and responding to behaviour safely, how to manage students’ complexities and specific needs, and trauma-informed practice.
Most principals (80 percent) think that PLD opportunities are an important or very important support compared to half of teachers (53 percent). One fifth of principals (22 percent) and teachers (20 percent) find it difficult or very difficult to access PLD.
Figure 63: Percentage of teachers and principals reporting how important and accessible PLD opportunities are
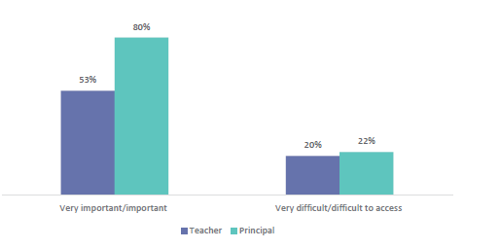
Staff highlighted the value of having professional learning and development that is around students’ complexities and specific needs, such as trauma-informed practice.
“I think upskilling the teachers’ understanding of complex behaviours and where it comes from is absolutely critical. Before, they were making judgements based on their belief that the kid just is not behaving. But why are… [the students] not behaving and what are the environmental factors? [Understanding] the personal factors around these kids and putting the staff through our own training… has seen a massive change in how we respond to young people.” (Principal)
4) Actions teachers and leaders are able to take
Teachers and principals are limited by the actions they can take and the levers they have to work with. Having the time to address behaviour, both proactively and reactively, is essential for all aspects of addressing behaviour effectively.
a) Time available
Time is the most important support that teachers and principals want and the one they have the least access to.
Having time to plan for and address behavioural issues is considered important or very important by four out of five (80 percent) teachers and almost all (94 percent) principals. Despite this, half of teachers (53 percent) and three out of five (60 percent) principals find it difficult or very difficult to access the time they need to tackle behaviour issues.
Figure 64: Percentage of teachers and principals reporting how important and accessible time to tackle behaviour issues is
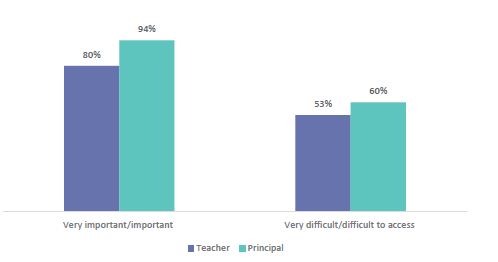
Time to plan and take proactive behaviour management measures is essential for effective behaviour management, but instead teachers in Aotearoa New Zealand’s time is being taken up by responding to high levels of challenging behaviour in the classroom.
We also heard the amount of time principals and teachers spend on addressing behaviour issues and organising or providing support is significant. Time is essential for building relationships with students, dealing with students’ needs, completing paperwork in the evening, and contacting and following up with parents and whānau about their child.
“Some of us are doing paperwork really late at night because we've [spent] a lot of time during the day and it's time that you actually need in order to build the relationship with that [student].” (Principal)
“There's a lot more time that is being needed to address all the various issues, and that puts a huge pressure on schools.” (Student support director)
“It's time consuming, getting those relationships because you need a relationship with that child and their parents because without it, if you haven't got those relationships, you're doomed…. Because… sometimes one child can take a lot of our resources, but that's what actually in the end helps that child. And we've seen that this year.” (Deputy principal)
b) Rules and guidelines
Rules, guidelines, and legislation for teachers and leaders managing behaviour refers to the resources that inform them about which steps to take when addressing behavioural issues, the appropriate consequences, and which aspects sit within their role. For example, the stand-downs, suspensions, exclusions, and expulsions guidelines, the physical restraint guidelines, and the Education and Training Act 2020.
Over half of teachers and principals feel access to legislation, guidelines, and rules is an important support but most can access these.
Being able to access legislation, guidelines, and rules is considered to be an important support by three out of five teachers (59 percent) and half (54 percent) of principals, and just 13 percent of teachers and 4 percent of principals find it difficult or very difficult to access.
Figure 65: Percentage of teachers and principals reporting how important and accessible legislation, rules, and guidelines are
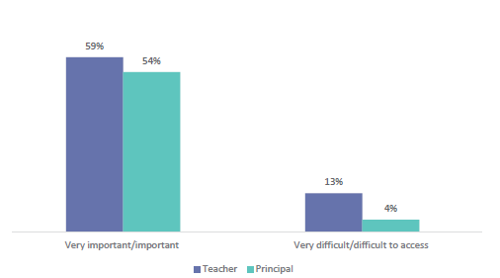
We have heard previously about the difficulties navigating supports as there are a range of websites and agencies to look at and this can be time consuming.(60)
5) External support
When dealing with behaviours that relate to complex needs, teachers need external, expert help. This includes services such as:
- Resource Teachers: Learning and Behaviour (RTLB) who work alongside schools to provide learning support when needed
- Ongoing Resourcing Scheme (ORS) which provides support for students who have the highest ongoing levels of need for specialist support
- the Behaviour Service (through local Ministry of Education office) where practitioners work with staff, children, parents and whānau, and specialists to codesign tailored support
- the Interim Response Fund, which can be accessed to help keep students engaged in learning following a challenging event
- in-class support funding provides a contribution toward a teacher aide for students with continuing high learning needs who are not funded through the ORS
- Te Kahu Tōī: Intensive Wraparound Service, which provides a way of responding when children experience significant challenges in their lives.
It also includes experts like educational psychologists and other specialists.
a) Specialist support from external agencies
Specialist support can be useful in cases of persistent or more intense behavioural issues and include services such as referrals to educational psychologists, and intensive wrap-around services.
Getting specialist support is the most important external support to teachers, however a third find it difficult to access this.
Two out of three teachers (65 percent) and three-quarters of principals (74 percent) consider this to be a important or very important support. One-third of teachers (34 percent) and two out of five principals (44 percent) find it difficult or very difficult to access.
Figure 66: Percentage of teachers and principals reporting how important and accessible specialist support are
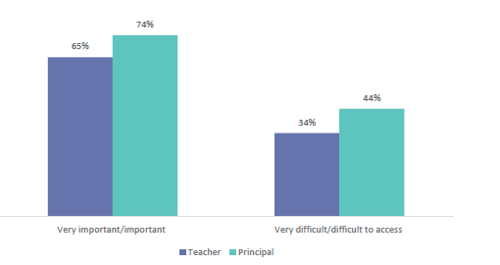
In staff focus groups we heard about the difficulties of getting specialist support for their students. Sometimes there are challenges coordinating all the different professionals involved but these supports are often very helpful when in place. We also heard that staff find it challenging trying to balance the needs and expectations set by external agencies for those students who require additional behaviour support and that there are often long waitlists for specialist supports due to a shortage of staff.
“My biggest concern and frustration is around access to resourcing… We can see the needs of these children. But the time and effort it takes to be able to access any sort of outside support and funding is really frustrating… because it needs to happen in a timely manner. When I talk to other principals, most of the time it's us having to recheck staffing to find money from other areas of the school where it might have gone, because number one, is supporting our teachers to be able to teach.” (Principal)
b) Behaviour support programmes
Behaviour support programmes are programmes schools can use to assist with their behaviour management through providing evidence-based resources and initiatives that support positive behaviour such as PB4L.
Behaviour support programmes are the second most important external support for schools and students and one of the easiest to access.
Three out of five teachers (58 percent) and five out of seven principals (71 percent) find behaviour support programmes important or very important. One in six teachers (15 percent) and one in 20 principals (6 percent) find it difficult or very difficult to access behaviour support programmes.
Figure 67: Percentage of teachers and principals reporting how important and accessible behaviour support programmes are
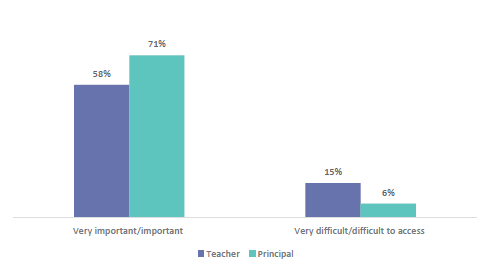
In focus groups we heard about a number of behaviour support programmes that are in place. These programmes are often working well for schools and tend to be at the centre of all their behaviour approaches. These work well when there is a designated staff member responsible for implementing and managing the program, sharing resources with other staff, and aiding the programme being properly embedded in the school.
“We have engaged [a local university]… We call it PC4L [Positive Culture for Learning]. And for those kids that works, it works really, really well.” (Deputy principal)
“I think the other thing is that every week on our school notice system and in the newsletter, [the PB4L/program] coach sends home the… PB4L lesson of the week. And so parents, teachers, children… everybody knows for that week what we're focusing on… It might be as basic as we walk into assembly quietly.” (Principal)
“If you work really hard on that and you build on it and you grow with them and you set really clear expectations and you're consistent and fair, those are the programmes that work really, really well.” (Special Educational Needs Coordinator)
c) Timely advice from experts
This is about being able to get in contact with, and receive advice from, experts, external agencies, and others when particular behavioural issues arise that need timely responses.
Getting timely advice is important to over half of teachers however more than a third find it difficult to access.
Over half of teachers (54 percent) and three-quarters (72 percent) of principals consider getting timely advice from experts, external agencies, and others to be an important or very important support. Two out of five teachers (39 percent) and half of principals (49 percent) find it difficult or very difficult to access.
Figure 68: Percentage of teachers and principals reporting how important and accessible timely advice from experts, external agencies, and others is
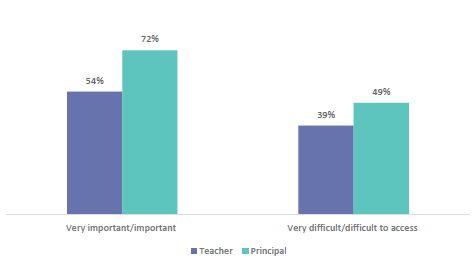
In focus groups we heard that advice from outside agencies can be really helpful when navigating difficult situations.
“We engage as many outside agencies as we possibly can. Some are super helpful.” (Team leader)
6) How does support look across different contexts?
This section sets out what we know about support when looking across different contexts, including:
- school age group
- school size
- schools in high and low socioeconomic communities
a) School age group
Teachers at secondary school feel the least supported, and that their behavioural policies and procedures are the least effective and applied the least consistently.
Teachers in secondary schools feel far less supported to manage behaviour in their classrooms. Just 37 percent of teachers at secondary schools feel supported or very supported, compared to 70 percent of teachers at intermediate and 61 percent at primary schools.
Despite the importance of behavioural policies and procedures, just one-quarter (24 percent) of secondary school teachers believe that their school’s behavioural policies and procedures are effective or very effective, compared to around half of teachers in intermediate (46 percent) and primary schools (51 percent). Additionally, only one in five (18 percent) secondary school teachers believe that their school applies these policies and procedures consistently, less than half as likely than those in primary or intermediate schools (46 percent).
Figure 69: Teachers’ perspectives on their policies and procedures, and how supported they are by school age group
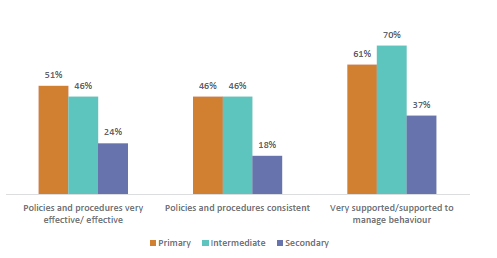
Secondary school teachers and principals are also less likely to think the actions they can take (time, rules, and guidelines), training (PLD), and the external supports (specialist support from external agencies, behavioural support programmes and timely advice from experts) are as important as primary school teachers and principals. For example, only 43 percent of secondary school teachers and 38 percent of secondary principals think timely advice from experts is important or very important while 70 percent of primary teachers and 79 percent of primary principals think this is important or very important.
b) School size
Principals at large schools feel their school behaviour policies and procedures are more effective.
Four out of five principals (80 percent) at large schools feel their school behaviour policy and procedures are effective or very effective, compared to two-thirds of principals at small schools (68 percent). However, principals of smaller schools feel that getting external specialist support and advice is easier to access.
Figure 70: Percentage of principals who feel their policies and procedures are very effective/effective across school size
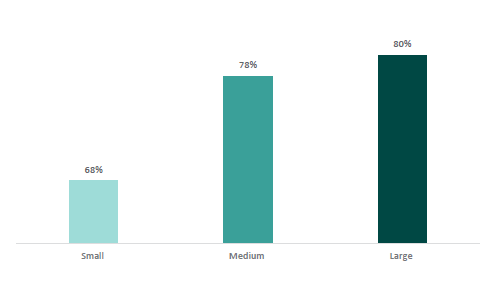
The more effective policies and procedures at larger schools may reflect the higher level of behaviour issues at large schools, that larger schools have more staff to contribute to behaviour policies and procedures and often have a dedicated staff member to take the lead on behaviour policies.
c) Schools in high and low socioeconomic communities
Teachers from schools in low socioeconomic communities feel less supported, and just one in four have confidence in their school’s policies and procedures.
Teachers in low socioeconomic feel less supported. Just 40 percent of teachers from schools in low socioeconomic communities feel supported or very supported as opposed to 55 percent from schools in high socioeconomic communities.
Additionally, just one-quarter (25 percent) of teachers from schools in low socioeconomic communities think that their school behavioural policies and procedures are effective or very effective, compared to 44 percent from schools in high socioeconomic communities. Additionally, teachers from schools in low socioeconomic communities feel that these behavioural policies and procedures are applied consistently less often (23 percent) than teachers from schools in high socioeconomic communities (36 percent).
Figure 71: Percentage of teachers who feel their policies and procedures are consistent and effective and feel supported across socioeconomic status
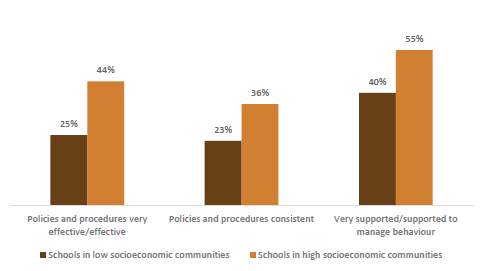
We know that schools in low socioeconomic communities have more challenges and are spending more time responding to behaviour. These factors mean they have less time to improve policies as they are spending a large amount of time reacting to behaviours they are seeing.
d) Teachers’ and principals’ experience
Teachers with six to nine years’ experience think their behaviour policies are the least effective.
Teachers with six to nine years’ experience think their behaviour policies are the least effective, with just over a quarter (26 percent) reporting they are effective or very effective, compared with 33 percent of those with less than five years’ experience and 38 percent of those with 10 years or more.
Figure 72: Percentage of teachers who feel their policies and procedures are very effective/effective by experience
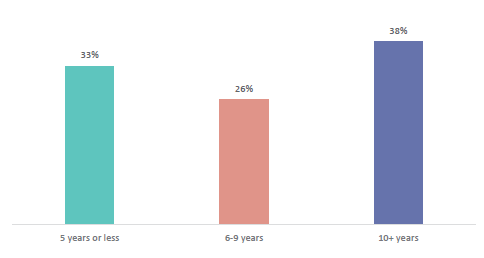
As shown earlier in this report, we found that teachers with six to nine years’ experience tend to feel greater impacts of behaviour on their stress and enjoyment of the job compared to those with five years or less, or with 10 years or more experience. It is likely that there is a similar driver for this finding: those with a greater amount of experience are more able to use their knowledge to contribute to and improve policies and procedures, and while those with less time in the role have a smaller range of experiences to draw from so may be more optimistic in their responses.
More experienced principals feel their behaviour policies and procedures are more consistent.
Principals with the most experience feel their behaviour policies are applied consistently with 75 percent agreeing or strongly agreeing, compared to 70 percent of those with six to nine years’ experience and 65 percent of those with five years or less.
Figure 73: Principals who strongly agree/agree their policies and procedures are consistent by experience
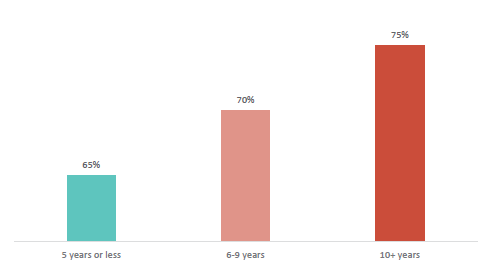
Principals with the most experience are likely to have found better ways to implement processes throughout their school over their time in the role and therefore feel their behaviour policies and procedures are more consistent.
Conclusion
Teachers and principals require more support to manage behaviours they are facing in the classroom. There is more that schools can do to support their staff, such as improving their behaviour policies and procedures, and ensuring these are more consistently applied throughout all classrooms. Teachers and principals are limited by the actions that they can take to manage behaviour. Schools need more support from external agencies and experts in order to deal with the behaviour problems that they are facing. Secondary schools and schools in low socio-economic communities are in particular need of more support.
Teachers need the right skills and support to manage classroom behaviours. A supportive environment, effective school policies and procedures, colleagues, and external specialists, allow teachers to prevent and respond to challenging behaviour with confidence.
Many teachers do not feel capable, confident, and supported to manage classroom behaviours. There is also a disconnect between how supported teachers feel and how supported principals believe their teachers are. Staff are limited by the actions they can take, and often struggle to access the support they need.
Having skills and being supported is incredibly important for teachers to be able to effectively manage classroom behaviours. This support is both internal and external to the school, and directly impacts teachers’ ability to manage the classroom behaviours they experience daily. This has impacts on learning for their students.
To understand what prevents teachers from managing behaviour, the support they receive, and the levers available to them, we looked at:
- our surveys of teachers and principals
- our focus groups with teachers, leaders, parents and whānau
- the available supports and resources for behaviour in Aotearoa New Zealand
This section looks at what teachers currently do to manage classroom behaviour, and the types of support that are available. It covers:
- teachers’ capability
- schools’ support for teachers
- support from professional learning and development
- actions teachers and leaders are able to take
- external support
- how support looks across different contexts.
What we found: An overview
Not all teachers are well supported to manage challenging classroom behaviour. More than one in eight teachers (12 percent) feel unsupported or very unsupported to manage challenging behaviour in the classroom. One in seven teachers (14 percent) think their school’s behaviour policies and procedures are ineffective or very ineffective and one in four (25 percent) feel these are not applied consistently at their school.
There is a disconnect between how supported principals think their teachers are and how supported teachers feel. Despite one in eight teachers (12 percent) feeling unsupported or very unsupported to manage challenging behaviour in the classroom, just 2 percent of principals think their staff are unsupported or very unsupported. Only one in 100 of principals (1 percent) think that their school’s behaviour policies and procedures are ineffective or very ineffective, and just 2 percent think they are not applied consistently.
Teachers and principals are limited by the actions they can take. Over half of teachers (53 percent) and principals (60 percent) find it difficult or very difficult to find the time they need to tackle behaviour issues.
Many teachers and principals struggle to access the external help they need. Half of teachers (54 percent) and three-quarters of principals (72 percent) find timely advice from experts, external agencies, and others to be an important or very important support. Yet 39 percent of teachers and half of principals (49 percent) find it difficult or very difficult to access this.
Teachers at secondary school feel the least supported, and that their behavioural policies and procedures are the least effective and applied the least consistently. Teachers in secondary schools feel far less supported to manage behaviour in their classrooms. Just 37 percent of teachers at secondary schools feel supported or very supported, compared to 70 percent of teachers at intermediate and 61 percent at primary schools.
Teachers from schools in low socioeconomic communities feel less supported, and just one in four have confidence in their school’s policies and procedures. Teachers in low socioeconomic communities feel less supported. Just 40 percent of teachers from schools in low socioeconomic communities feel supported or very supported as opposed to 55 percent from schools in high socioeconomic communities.
Additionally, just one-quarter (25 percent) of teachers from schools in low socioeconomic communities think that their school behavioural policies and procedures are effective or very effective, compared to 44 percent from schools in high socioeconomic communities. Additionally, teachers from schools in low socioeconomic communities feel that these behavioural policies and procedures are applied consistently less often (23 percent) than teachers from schools in high socioeconomic communities (36 percent).
1) Teacher capability
Teacher capability is critical for effective behaviour management in the classroom. Capability is crucial for:
- getting to know and understand students
- employing effective strategies in behaviour management
- responding effectively to behaviour
- creating and using targeted approaches.
New teachers aren’t confident to manage classroom behaviour.
In their first term of teaching, under half of new teachers report being capable in managing classroom behaviour (45 percent) and over one-third (35 percent) report they are not capable. After two years, 86 percent report being capable, but 5 percent still report not being capable in managing classroom behaviour. This is one of the areas they are the least prepared for when they start.(58)
Figure 60: Teachers’ confidence to manage classroom behaviour in their first term and after two years of teaching.
Older new teachers (aged 36 and above) are more prepared to manage behaviour in their first term teaching than teachers aged 35 or younger.
Despite connecting with parents and whānau being a key part of successful behaviour approaches, many new teachers struggle to do this.
Involving parents and whānau in the creation and ongoing use of behavioural expectations within the school is an important part of successful behavioural approaches in schools. We heard in focus groups that parents and whānau feel disconnected from the school when it comes to expectations and approaches for students’ behaviour in class, sometimes due to behavioural expectations or responses being different between home and school.
In their first term of teaching, just half (48 percent) of new teachers report being capable in working with parents, and over one-quarter (27 percent) report not being capable. This is the second weakest area in terms of how capable they feel in their first term. After two years, 87 percent report being capable working with parents and just 4 percent report not being capable.(59)
Parents and whānau also talked about having trust in school staff and knowing the school’s lines of communication when an issue arose with their child’s behaviour - from the teacher through to the principal.
“Through our [policy] review… [we're] continually reviewing them and strengthening them. So we're pleased that they are best practice, in our view. And we're constantly going to… make sure that we follow process when it gets tricky. We just have to follow procedure and process… It's about having that stuff on your website, being transparent about it, and always getting it out and using it.” (Principal)
2) Schools’ support for teachers
Schools’ support for teachers is important for teachers managing challenging classroom behaviours as it provides teachers with policies and procedures they can use and refer to in behaviour management and expectation setting. Support with school staff through collegial support, planning responses to behaviour in teams, and sharing strategies and ideas can increase the confidence and provide ideas to teachers on how best to manage behaviour in the classroom. Strong school support is particularly important in allowing teachers to:
- use a consistent approach to prevent and manage challenging behaviour
- use targeted approaches to meet the individual needs of students.
Not all teachers are supported to manage challenging classroom behaviour.
While almost half of teachers do feel supported to manage challenging behaviour in the classroom, there is still a substantial group who do not feel supported. One in eight teachers (12 percent) feel unsupported or very unsupported to manage challenging behaviour in the classroom.
Figure 61: How supported teachers are to manage challenging behaviour
Effective policies and consistent application are important to enable teachers to successfully manage behaviour. While many teachers think their policies and procedures are working at their school, one in seven teachers (14 percent) think that their school’s behaviour policies and procedures are ineffective or very ineffective, and one in four (25 percent) feel that these are not applied consistently at their school.
In focus groups we heard about the importance of staff support for managing behaviour. One common theme is about how important the team approach to solving problems is and how this helps staff to feel supported when dealing with behaviour issues.
“I think we’re really lucky. We’ve got a really supportive management team. Like if we have issues, we’re able to go and talk through it and then they might come in and try to help… like we can sort it out.” (Teacher)
“We actually brainstorm as a staff [on] strategies for how we could get better behaviour from those children… which is quite good. You’re not feeling isolated. If you’ve got a child, you’re getting the whole team working together to support.” (Teacher)
There is a disconnect between how supported principals think their staff are and how supported staff feel.
It is important that the entire school is on the same page when it comes to policies and procedures surrounding behaviours. Despite one in eight teachers (12 percent) feeling unsupported or very unsupported to manage challenging behaviour in the classroom, just 2 percent of principals think their staff are unsupported or very unsupported. In addition, despite one in seven teachers (14 percent) thinking their school’s behaviour policies and procedures are ineffective or very ineffective, only one in 100 principals (1 percent) report this. Similarly, one in four teachers think school behaviour policies are not applied consistently, a view shared by only one in 50 (2 percent) principals.
Figure 62: Principals and teachers reporting that their behaviour policies and procedures are ineffective and not applied consistently
In focus groups we heard staff talk about the importance of transparency, including reviewing behaviour policies and procedures and having these on the school’s website.
Supports that teachers and principals can use
There are a number of ways that teachers and principals can be supported to manage behaviour at their school. Below we set out the how important and accessible different types of supports are for teachers and principals.
Table 3: Summary of how important teachers and principals find each support, ordered by teachers’ ratings
|
|
Percent of teachers reporting supports as very important/important |
Percent of principals reporting supports as very important/important |
|
Time to tackle behaviour issues
|
80% |
94% |
|
Specialist support from external agencies
|
65% |
74% |
|
Legislation guidelines and rules
|
59% |
54% |
|
Behaviour support programmes
|
58% |
71% |
|
Timely advice from experts
|
54% |
72% |
|
Professional learning and development
|
53% |
80% |
Table 4: Summary of how difficult teachers and principals find each support to access, ordered by teachers’ ratings
|
|
Percent of teachers who report support as very difficult/difficult to access |
Percent of principals who report support as very difficult/difficult to access |
|
Time to tackle behaviour issues
|
53%
|
60% |
|
Timely advice from experts
|
39% |
49% |
|
Specialist support from external agencies
|
34% |
44% |
|
Professional learning and development
|
20% |
22% |
|
Behaviour support programmes
|
15% |
6% |
|
Legislation guidelines and rules
|
13% |
4% |
3) Support from professional learning and development
Support from evidenced based professional learning and development (PLD) can be beneficial for teachers in being able to manage challenging behaviour proactively and reactively, as well as gaining a greater understanding of the influences and personal factors contributing to the way that students behave. Depending on the type of PLD accessed, benefits can be seen across all areas of practice.
Professional learning and development is the most important external support to principals but the least important external support to teachers.
Professional learning and development for managing challenging behaviour may include teaching around understanding and responding to behaviour safely, how to manage students’ complexities and specific needs, and trauma-informed practice.
Most principals (80 percent) think that PLD opportunities are an important or very important support compared to half of teachers (53 percent). One fifth of principals (22 percent) and teachers (20 percent) find it difficult or very difficult to access PLD.
Figure 63: Percentage of teachers and principals reporting how important and accessible PLD opportunities are
Staff highlighted the value of having professional learning and development that is around students’ complexities and specific needs, such as trauma-informed practice.
“I think upskilling the teachers’ understanding of complex behaviours and where it comes from is absolutely critical. Before, they were making judgements based on their belief that the kid just is not behaving. But why are… [the students] not behaving and what are the environmental factors? [Understanding] the personal factors around these kids and putting the staff through our own training… has seen a massive change in how we respond to young people.” (Principal)
4) Actions teachers and leaders are able to take
Teachers and principals are limited by the actions they can take and the levers they have to work with. Having the time to address behaviour, both proactively and reactively, is essential for all aspects of addressing behaviour effectively.
a) Time available
Time is the most important support that teachers and principals want and the one they have the least access to.
Having time to plan for and address behavioural issues is considered important or very important by four out of five (80 percent) teachers and almost all (94 percent) principals. Despite this, half of teachers (53 percent) and three out of five (60 percent) principals find it difficult or very difficult to access the time they need to tackle behaviour issues.
Figure 64: Percentage of teachers and principals reporting how important and accessible time to tackle behaviour issues is
Time to plan and take proactive behaviour management measures is essential for effective behaviour management, but instead teachers in Aotearoa New Zealand’s time is being taken up by responding to high levels of challenging behaviour in the classroom.
We also heard the amount of time principals and teachers spend on addressing behaviour issues and organising or providing support is significant. Time is essential for building relationships with students, dealing with students’ needs, completing paperwork in the evening, and contacting and following up with parents and whānau about their child.
“Some of us are doing paperwork really late at night because we've [spent] a lot of time during the day and it's time that you actually need in order to build the relationship with that [student].” (Principal)
“There's a lot more time that is being needed to address all the various issues, and that puts a huge pressure on schools.” (Student support director)
“It's time consuming, getting those relationships because you need a relationship with that child and their parents because without it, if you haven't got those relationships, you're doomed…. Because… sometimes one child can take a lot of our resources, but that's what actually in the end helps that child. And we've seen that this year.” (Deputy principal)
b) Rules and guidelines
Rules, guidelines, and legislation for teachers and leaders managing behaviour refers to the resources that inform them about which steps to take when addressing behavioural issues, the appropriate consequences, and which aspects sit within their role. For example, the stand-downs, suspensions, exclusions, and expulsions guidelines, the physical restraint guidelines, and the Education and Training Act 2020.
Over half of teachers and principals feel access to legislation, guidelines, and rules is an important support but most can access these.
Being able to access legislation, guidelines, and rules is considered to be an important support by three out of five teachers (59 percent) and half (54 percent) of principals, and just 13 percent of teachers and 4 percent of principals find it difficult or very difficult to access.
Figure 65: Percentage of teachers and principals reporting how important and accessible legislation, rules, and guidelines are
We have heard previously about the difficulties navigating supports as there are a range of websites and agencies to look at and this can be time consuming.(60)
5) External support
When dealing with behaviours that relate to complex needs, teachers need external, expert help. This includes services such as:
- Resource Teachers: Learning and Behaviour (RTLB) who work alongside schools to provide learning support when needed
- Ongoing Resourcing Scheme (ORS) which provides support for students who have the highest ongoing levels of need for specialist support
- the Behaviour Service (through local Ministry of Education office) where practitioners work with staff, children, parents and whānau, and specialists to codesign tailored support
- the Interim Response Fund, which can be accessed to help keep students engaged in learning following a challenging event
- in-class support funding provides a contribution toward a teacher aide for students with continuing high learning needs who are not funded through the ORS
- Te Kahu Tōī: Intensive Wraparound Service, which provides a way of responding when children experience significant challenges in their lives.
It also includes experts like educational psychologists and other specialists.
a) Specialist support from external agencies
Specialist support can be useful in cases of persistent or more intense behavioural issues and include services such as referrals to educational psychologists, and intensive wrap-around services.
Getting specialist support is the most important external support to teachers, however a third find it difficult to access this.
Two out of three teachers (65 percent) and three-quarters of principals (74 percent) consider this to be a important or very important support. One-third of teachers (34 percent) and two out of five principals (44 percent) find it difficult or very difficult to access.
Figure 66: Percentage of teachers and principals reporting how important and accessible specialist support are
In staff focus groups we heard about the difficulties of getting specialist support for their students. Sometimes there are challenges coordinating all the different professionals involved but these supports are often very helpful when in place. We also heard that staff find it challenging trying to balance the needs and expectations set by external agencies for those students who require additional behaviour support and that there are often long waitlists for specialist supports due to a shortage of staff.
“My biggest concern and frustration is around access to resourcing… We can see the needs of these children. But the time and effort it takes to be able to access any sort of outside support and funding is really frustrating… because it needs to happen in a timely manner. When I talk to other principals, most of the time it's us having to recheck staffing to find money from other areas of the school where it might have gone, because number one, is supporting our teachers to be able to teach.” (Principal)
b) Behaviour support programmes
Behaviour support programmes are programmes schools can use to assist with their behaviour management through providing evidence-based resources and initiatives that support positive behaviour such as PB4L.
Behaviour support programmes are the second most important external support for schools and students and one of the easiest to access.
Three out of five teachers (58 percent) and five out of seven principals (71 percent) find behaviour support programmes important or very important. One in six teachers (15 percent) and one in 20 principals (6 percent) find it difficult or very difficult to access behaviour support programmes.
Figure 67: Percentage of teachers and principals reporting how important and accessible behaviour support programmes are
In focus groups we heard about a number of behaviour support programmes that are in place. These programmes are often working well for schools and tend to be at the centre of all their behaviour approaches. These work well when there is a designated staff member responsible for implementing and managing the program, sharing resources with other staff, and aiding the programme being properly embedded in the school.
“We have engaged [a local university]… We call it PC4L [Positive Culture for Learning]. And for those kids that works, it works really, really well.” (Deputy principal)
“I think the other thing is that every week on our school notice system and in the newsletter, [the PB4L/program] coach sends home the… PB4L lesson of the week. And so parents, teachers, children… everybody knows for that week what we're focusing on… It might be as basic as we walk into assembly quietly.” (Principal)
“If you work really hard on that and you build on it and you grow with them and you set really clear expectations and you're consistent and fair, those are the programmes that work really, really well.” (Special Educational Needs Coordinator)
c) Timely advice from experts
This is about being able to get in contact with, and receive advice from, experts, external agencies, and others when particular behavioural issues arise that need timely responses.
Getting timely advice is important to over half of teachers however more than a third find it difficult to access.
Over half of teachers (54 percent) and three-quarters (72 percent) of principals consider getting timely advice from experts, external agencies, and others to be an important or very important support. Two out of five teachers (39 percent) and half of principals (49 percent) find it difficult or very difficult to access.
Figure 68: Percentage of teachers and principals reporting how important and accessible timely advice from experts, external agencies, and others is
In focus groups we heard that advice from outside agencies can be really helpful when navigating difficult situations.
“We engage as many outside agencies as we possibly can. Some are super helpful.” (Team leader)
6) How does support look across different contexts?
This section sets out what we know about support when looking across different contexts, including:
- school age group
- school size
- schools in high and low socioeconomic communities
a) School age group
Teachers at secondary school feel the least supported, and that their behavioural policies and procedures are the least effective and applied the least consistently.
Teachers in secondary schools feel far less supported to manage behaviour in their classrooms. Just 37 percent of teachers at secondary schools feel supported or very supported, compared to 70 percent of teachers at intermediate and 61 percent at primary schools.
Despite the importance of behavioural policies and procedures, just one-quarter (24 percent) of secondary school teachers believe that their school’s behavioural policies and procedures are effective or very effective, compared to around half of teachers in intermediate (46 percent) and primary schools (51 percent). Additionally, only one in five (18 percent) secondary school teachers believe that their school applies these policies and procedures consistently, less than half as likely than those in primary or intermediate schools (46 percent).
Figure 69: Teachers’ perspectives on their policies and procedures, and how supported they are by school age group
Secondary school teachers and principals are also less likely to think the actions they can take (time, rules, and guidelines), training (PLD), and the external supports (specialist support from external agencies, behavioural support programmes and timely advice from experts) are as important as primary school teachers and principals. For example, only 43 percent of secondary school teachers and 38 percent of secondary principals think timely advice from experts is important or very important while 70 percent of primary teachers and 79 percent of primary principals think this is important or very important.
b) School size
Principals at large schools feel their school behaviour policies and procedures are more effective.
Four out of five principals (80 percent) at large schools feel their school behaviour policy and procedures are effective or very effective, compared to two-thirds of principals at small schools (68 percent). However, principals of smaller schools feel that getting external specialist support and advice is easier to access.
Figure 70: Percentage of principals who feel their policies and procedures are very effective/effective across school size
The more effective policies and procedures at larger schools may reflect the higher level of behaviour issues at large schools, that larger schools have more staff to contribute to behaviour policies and procedures and often have a dedicated staff member to take the lead on behaviour policies.
c) Schools in high and low socioeconomic communities
Teachers from schools in low socioeconomic communities feel less supported, and just one in four have confidence in their school’s policies and procedures.
Teachers in low socioeconomic feel less supported. Just 40 percent of teachers from schools in low socioeconomic communities feel supported or very supported as opposed to 55 percent from schools in high socioeconomic communities.
Additionally, just one-quarter (25 percent) of teachers from schools in low socioeconomic communities think that their school behavioural policies and procedures are effective or very effective, compared to 44 percent from schools in high socioeconomic communities. Additionally, teachers from schools in low socioeconomic communities feel that these behavioural policies and procedures are applied consistently less often (23 percent) than teachers from schools in high socioeconomic communities (36 percent).
Figure 71: Percentage of teachers who feel their policies and procedures are consistent and effective and feel supported across socioeconomic status
We know that schools in low socioeconomic communities have more challenges and are spending more time responding to behaviour. These factors mean they have less time to improve policies as they are spending a large amount of time reacting to behaviours they are seeing.
d) Teachers’ and principals’ experience
Teachers with six to nine years’ experience think their behaviour policies are the least effective.
Teachers with six to nine years’ experience think their behaviour policies are the least effective, with just over a quarter (26 percent) reporting they are effective or very effective, compared with 33 percent of those with less than five years’ experience and 38 percent of those with 10 years or more.
Figure 72: Percentage of teachers who feel their policies and procedures are very effective/effective by experience
As shown earlier in this report, we found that teachers with six to nine years’ experience tend to feel greater impacts of behaviour on their stress and enjoyment of the job compared to those with five years or less, or with 10 years or more experience. It is likely that there is a similar driver for this finding: those with a greater amount of experience are more able to use their knowledge to contribute to and improve policies and procedures, and while those with less time in the role have a smaller range of experiences to draw from so may be more optimistic in their responses.
More experienced principals feel their behaviour policies and procedures are more consistent.
Principals with the most experience feel their behaviour policies are applied consistently with 75 percent agreeing or strongly agreeing, compared to 70 percent of those with six to nine years’ experience and 65 percent of those with five years or less.
Figure 73: Principals who strongly agree/agree their policies and procedures are consistent by experience
Principals with the most experience are likely to have found better ways to implement processes throughout their school over their time in the role and therefore feel their behaviour policies and procedures are more consistent.
Conclusion
Teachers and principals require more support to manage behaviours they are facing in the classroom. There is more that schools can do to support their staff, such as improving their behaviour policies and procedures, and ensuring these are more consistently applied throughout all classrooms. Teachers and principals are limited by the actions that they can take to manage behaviour. Schools need more support from external agencies and experts in order to deal with the behaviour problems that they are facing. Secondary schools and schools in low socio-economic communities are in particular need of more support.
Chapter 7: Good practice in managing behaviour
ERO reviewed the international and local evidence base to find the most effective practices for managing challenging behaviour in schools and also visited schools across Aotearoa New Zealand to capture good practice. This chapter summarises six practice areas that make the most difference. Each practice area is broken into key practices, with real-life strategies and examples.
We unpack these in greater detail in our companion report Good Practice: Behaviour in our Classrooms and accompanying guides for teachers, leaders and boards.
Evidence-based practice
Behaviour management strategies support all students in the class
Positive classroom behaviour creates the conditions for all students to focus and achieve. This is because when even one student is off-task and behaving poorly, there are negative impacts on learning and achievement throughout the classroom:
- the student who is behaving poorly is not focused on their schoolwork
- the peers of that student are distracted by or concerned about the behaviour, meaning they are not focused on their schoolwork
- the teacher of that student needs to respond to (or actively monitor) that behaviour, meaning they are not focused on their teaching of the schoolwork.
Managing behaviour is not just about supporting one or two students to stop their challenging behaviour – it’s about using a range of proactive and reactive strategies practices to ensure all students in the class are able to do their best work.
Effective behaviour management uses a combination of ‘proactive’ and ‘reactive’ strategies
‘Proactive’ strategies are designed to reduce the likelihood of challenging behaviour occurring. They include preventative measures such as establishing clear expectations and rewarding good behaviour when it occurs.(61) Proactive strategies require good knowledge of students and strong relationships, developing school-wide approaches for managing behaviour, and explicitly teaching ‘learning behaviours’.
‘Reactive’ strategies are intended to help teachers and leaders manage challenging behaviour when it does occur. These ensure that incidents are managed safely and efficiently.(62) Reactive strategies include having a clear plan for responding to incidents, using targeted approaches for some students, and responding to challenging behaviour with fair and logical consequences and working to restore relationships.
Proactive strategies should be used more often than reactive strategies
The evidence base shows that the best approaches for managing challenging behaviour use a combination of proactive and reactive strategies, with proactive strategies being used most often and reactive strategies being used only when needed. This combination is particularly important for students who have extremely challenging behaviour.(63)
Figure 74: ERO’s six practice areas move from proactive, class-wide strategies (used most often), to more reactive and individualised approaches (used more rarely).
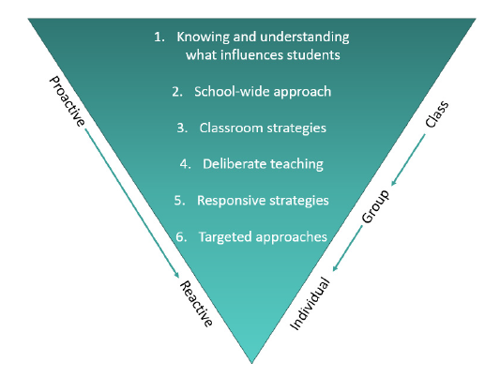
There are six key areas of practice
Below is an overview of the six practice areas that are set out in this report. These sit across both proactive strategies to prevent challenging behaviour and reactive strategies for responding to challenging behaviour in the moment.
|
Practice area 1 |
Know and understand students and what influences their behaviour (proactive) |
|
Practice area 2 |
Use a consistent approach across the school to prevent and manage challenging behaviour (proactive) |
|
Practice area 3 |
Use strategies in the classroom to support expected behaviour (proactive) |
|
Practice area 4 |
Teach learning behaviours alongside managing challenging behaviour (proactive and reactive) |
|
Practice area 5 |
Respond effectively to behaviour (reactive) |
|
Practice area 6 |
Use targeted approaches to meet the individual needs of students (reactive) |
The six practice areas in this report are a mix of ‘proactive’ and ‘reactive’ strategies
The practice areas sit across both proactive strategies to prevent challenging behaviour and reactive strategies for responding to challenging behaviour in the moment.
Practice area 1: Know and understand students and what influences their behaviour (proactive)
This involves teachers sourcing information about the range of factors that influence student behaviour. These include past behaviours and incidents, attendance and achievement information, individual needs, and family or wider community contexts. Knowing about these influences equips teachers to understand classroom behaviours and choose effective strategies.
Key teacher practices are:
- finding out about the influences or triggers on students’ behaviour
- ensuring every student has a positive relationship with at least one member of staff – ideally their classroom teacher.
Why this is important
Behaviour in the classroom is influenced by a range of factors. Many of these are external to what happens within the immediate classroom – like past behaviour, incidents of bullying, attendance and achievement information, individual needs, out-of-school interests, parents and whānau or community contexts. Teachers and leaders are better equipped to respond to challenging behaviours if they are well informed about the wider context for that behaviour. Being informed empowers teachers to have influence within the classroom: to prevent, predict, and respond to behaviours using what they know about students.(64)
Taking steps to get to know your students well also helps with building learning-focused relationships with students and bolstering students’ sense of belonging at the school. These are both strongly reflected in the research evidence base as positive influences on both student achievement and behaviour at school.(65)
Practice area 2: Use a consistent approach across the school to prevent and manage challenging behaviour (proactive)
A whole-school approach to behaviour management means all staff and students have shared understandings and clear expectations around behaviour. A whole-school approach includes training for teachers and support staff (e.g. teacher aides) on how to implement agreed behaviour management strategies, as well as careful monitoring across the school through systematically tracking behaviour data.(66)
Key teacher practices are:
- establishing a clear school-wide behaviour approach and consistently apply this
- using data to track school behaviour
- ensuring teachers are skilled in and supported to implement evidence-based behaviour strategies.
Why this is important
Behaviour management approaches are more likely to have a positive impact on student achievement outcomes if they are well understood and implemented consistently across the whole school.(67) This is because a whole school approach makes expectations and norms around behaviour clear for everyone. Clarity and consistency help students to know what is expected of them, and to reflect on and monitor their own behaviour.(68) This creates a predictable experience for all students, overlapping with and reinforcing classroom-level strategies.(69)
Practice area 3: Use strategies in the classroom to support expected behaviour (proactive)
Classroom strategies for managing behaviour start with setting high behavioural expectations and clear, logical consequences for challenging behaviour. These are developed and implemented with students, then documented, discussed often, and consistently applied.
Key teacher practices are:
- developing and implementing with students a set of class behavioural expectations and consequences
- establishing and reinforcing clear and consistent class routines that are taught from day one
- organising the layout of the classroom to support positive behaviour
- giving specific praise and incentives for positive behaviour throughout lessons
- displaying visual aids about expected behaviours around the classroom.
Why this is important
Effective classroom strategies reduce challenging behaviour and lead to improved achievement, better attendance, and a more purposeful learning climate.(70) They do this by supporting positive learning and social behaviours that align with the core values of the school.(71) The classroom environment – including the rules and expectations within that environment – is a powerful tool for discouraging challenging behaviour, and encouraging focused learning. Teachers offering specific praise or rewards to students for positive behaviour increases the chances of students showing them.
Practice area 4: Teach learning behaviours alongside managing challenging behaviour (proactive and reactive)
This practice area involves explicitly teaching students positive classroom behaviours like listening to instructions, working well with classmates, monitoring their own behaviour, and persisting with classroom tasks. Setting students up with positive learning behaviours reduces the need to manage challenging behaviour, ensuring that all students are able to engage in class work and achieve in school.
Key teacher practices are:
- using classroom teaching practices that promote focused learning
- providing opportunities to learn positive social behaviours with peers
- coaching and prompting students to regulate their own behaviour.
Why this is important
Teaching and reinforcing learning behaviours reduces the need to manage challenging behaviour. This is because the more engaged and motivated students are, the less likely they are to behave poorly, and the less time teachers need to spend managing behaviour.(72) Once learning behaviours are well-embedded in the classroom, teachers can focus more on teaching planned lessons, rather than responding to behaviour issues. Learning behaviours are key to academic achievement across all students in the class.(73)
Practice area 5: Respond effectively to behaviour (reactive)
This practice area is about teachers being well prepared and feeling confident to respond effectively to challenging behaviour. Having a set of pre-planned responses for common behaviours means teachers can respond efficiently and effectively, preventing the behaviour from escalating. There is a range of responses that teachers can use, ranging from low-level (e.g. corrective feedback) to high-level (e.g. logical consequences).
Key teacher practices are:
- planning responses to common and frequent behaviours in advance
- responding appropriately using relevant strategies, including:
- corrective feedback
- reminders (‘warning’ at secondary school level)
- redirections
- logical consequences.
Why this is important
Occasional challenging behaviour will occur in even in the most well-organised classroom environments. This means that teachers need to be prepared to respond to challenging behaviour, alongside embedding good-quality behaviour expectations and preventative practices. Without immediate and appropriate responses from teachers, challenging behaviours can quickly escalate and present risks to students and school staff.(74)
For less serious behaviours, structured feedback from teachers helps students develop better self-management skills.
For more serious or recurring behaviours, it’s most effective to enforce logical consequences that reinforce agreed rules and expectations are proportional to the student’s behaviour and support all students to know what behaviour is expected at school. Logical consequences should reflect agreed schoolwide practices.(75)
Practice area 6: Use targeted approaches to meet the individual needs of students (reactive)
Targeted approaches are intended for students with the most challenging behaviour. Leaders and teachers work with experts and parents and whānau to plan and implement specific strategies for individual students, that align with the whole-school behaviour management approach. Students will often be involved in the process of developing their own plans.
There are a range of behaviour support available to schools in Aotearoa New Zealand which should be accessed when typical behaviour management strategies are not effective. Schools can draw on expertise from RTLB, Social Workers in Schools (SWIS), counsellors, and through funding programmes such as the interim response fund and Te Kahu Tōi: Intensive Wraparound Service, and other supports.(76)
Key teacher practices are:
- adapting approaches to individual needs, for students with more challenging behaviour
- planning with school staff, the student, their parents and whānau, and others (as required) to address and respond to extreme or persistent behaviour
- getting expert help when required.
Why this is important
A school’s usual approach to behaviour management is designed to prevent and respond to the majority of behaviours in a school, but may be insufficient to meet the needs of the most challenging students. In these cases, a school’s clear expectations and norms around behaviour should form the backbone of a more targeted approach to behaviour management for these individual students.(77)
Targeted approaches are most effective when tailored to students’ needs and the context in which their behaviour is most likely to occur (e.g. during a particular class, activity, or time in the day).(78) When designing targeted approaches, schools also need to consider influences in students’ lives from outside of school.(79) For this reason, it is effective to include parents and whānau, the student themselves and relevant health/psychological professionals in the development of the plan. This allows teachers to match their response with underlying causes and influences on that student’s behaviour.
These six key areas of practice work as a set of effective practices. When teachers and leaders develop proficiency in each of these areas the evidence shows that behaviour and academic achievement improve. For more about these six practice areas see our companion good practice report.
Conclusion
Positive classroom behaviour creates the conditions for all students to focus and achieve. Managing behaviour is not just about supporting one or two students to stop their challenging behaviour – it’s about using a range of proactive and reactive strategies practices to ensure all students in the class are able to do their best work. The six practice areas outlined in this chapter, and detailed in our companion report Good Practice: Behaviour in our Classrooms, make a real difference to classroom behaviour management.
ERO reviewed the international and local evidence base to find the most effective practices for managing challenging behaviour in schools and also visited schools across Aotearoa New Zealand to capture good practice. This chapter summarises six practice areas that make the most difference. Each practice area is broken into key practices, with real-life strategies and examples.
We unpack these in greater detail in our companion report Good Practice: Behaviour in our Classrooms and accompanying guides for teachers, leaders and boards.
Evidence-based practice
Behaviour management strategies support all students in the class
Positive classroom behaviour creates the conditions for all students to focus and achieve. This is because when even one student is off-task and behaving poorly, there are negative impacts on learning and achievement throughout the classroom:
- the student who is behaving poorly is not focused on their schoolwork
- the peers of that student are distracted by or concerned about the behaviour, meaning they are not focused on their schoolwork
- the teacher of that student needs to respond to (or actively monitor) that behaviour, meaning they are not focused on their teaching of the schoolwork.
Managing behaviour is not just about supporting one or two students to stop their challenging behaviour – it’s about using a range of proactive and reactive strategies practices to ensure all students in the class are able to do their best work.
Effective behaviour management uses a combination of ‘proactive’ and ‘reactive’ strategies
‘Proactive’ strategies are designed to reduce the likelihood of challenging behaviour occurring. They include preventative measures such as establishing clear expectations and rewarding good behaviour when it occurs.(61) Proactive strategies require good knowledge of students and strong relationships, developing school-wide approaches for managing behaviour, and explicitly teaching ‘learning behaviours’.
‘Reactive’ strategies are intended to help teachers and leaders manage challenging behaviour when it does occur. These ensure that incidents are managed safely and efficiently.(62) Reactive strategies include having a clear plan for responding to incidents, using targeted approaches for some students, and responding to challenging behaviour with fair and logical consequences and working to restore relationships.
Proactive strategies should be used more often than reactive strategies
The evidence base shows that the best approaches for managing challenging behaviour use a combination of proactive and reactive strategies, with proactive strategies being used most often and reactive strategies being used only when needed. This combination is particularly important for students who have extremely challenging behaviour.(63)
Figure 74: ERO’s six practice areas move from proactive, class-wide strategies (used most often), to more reactive and individualised approaches (used more rarely).
There are six key areas of practice
Below is an overview of the six practice areas that are set out in this report. These sit across both proactive strategies to prevent challenging behaviour and reactive strategies for responding to challenging behaviour in the moment.
|
Practice area 1 |
Know and understand students and what influences their behaviour (proactive) |
|
Practice area 2 |
Use a consistent approach across the school to prevent and manage challenging behaviour (proactive) |
|
Practice area 3 |
Use strategies in the classroom to support expected behaviour (proactive) |
|
Practice area 4 |
Teach learning behaviours alongside managing challenging behaviour (proactive and reactive) |
|
Practice area 5 |
Respond effectively to behaviour (reactive) |
|
Practice area 6 |
Use targeted approaches to meet the individual needs of students (reactive) |
The six practice areas in this report are a mix of ‘proactive’ and ‘reactive’ strategies
The practice areas sit across both proactive strategies to prevent challenging behaviour and reactive strategies for responding to challenging behaviour in the moment.
Practice area 1: Know and understand students and what influences their behaviour (proactive)
This involves teachers sourcing information about the range of factors that influence student behaviour. These include past behaviours and incidents, attendance and achievement information, individual needs, and family or wider community contexts. Knowing about these influences equips teachers to understand classroom behaviours and choose effective strategies.
Key teacher practices are:
- finding out about the influences or triggers on students’ behaviour
- ensuring every student has a positive relationship with at least one member of staff – ideally their classroom teacher.
Why this is important
Behaviour in the classroom is influenced by a range of factors. Many of these are external to what happens within the immediate classroom – like past behaviour, incidents of bullying, attendance and achievement information, individual needs, out-of-school interests, parents and whānau or community contexts. Teachers and leaders are better equipped to respond to challenging behaviours if they are well informed about the wider context for that behaviour. Being informed empowers teachers to have influence within the classroom: to prevent, predict, and respond to behaviours using what they know about students.(64)
Taking steps to get to know your students well also helps with building learning-focused relationships with students and bolstering students’ sense of belonging at the school. These are both strongly reflected in the research evidence base as positive influences on both student achievement and behaviour at school.(65)
Practice area 2: Use a consistent approach across the school to prevent and manage challenging behaviour (proactive)
A whole-school approach to behaviour management means all staff and students have shared understandings and clear expectations around behaviour. A whole-school approach includes training for teachers and support staff (e.g. teacher aides) on how to implement agreed behaviour management strategies, as well as careful monitoring across the school through systematically tracking behaviour data.(66)
Key teacher practices are:
- establishing a clear school-wide behaviour approach and consistently apply this
- using data to track school behaviour
- ensuring teachers are skilled in and supported to implement evidence-based behaviour strategies.
Why this is important
Behaviour management approaches are more likely to have a positive impact on student achievement outcomes if they are well understood and implemented consistently across the whole school.(67) This is because a whole school approach makes expectations and norms around behaviour clear for everyone. Clarity and consistency help students to know what is expected of them, and to reflect on and monitor their own behaviour.(68) This creates a predictable experience for all students, overlapping with and reinforcing classroom-level strategies.(69)
Practice area 3: Use strategies in the classroom to support expected behaviour (proactive)
Classroom strategies for managing behaviour start with setting high behavioural expectations and clear, logical consequences for challenging behaviour. These are developed and implemented with students, then documented, discussed often, and consistently applied.
Key teacher practices are:
- developing and implementing with students a set of class behavioural expectations and consequences
- establishing and reinforcing clear and consistent class routines that are taught from day one
- organising the layout of the classroom to support positive behaviour
- giving specific praise and incentives for positive behaviour throughout lessons
- displaying visual aids about expected behaviours around the classroom.
Why this is important
Effective classroom strategies reduce challenging behaviour and lead to improved achievement, better attendance, and a more purposeful learning climate.(70) They do this by supporting positive learning and social behaviours that align with the core values of the school.(71) The classroom environment – including the rules and expectations within that environment – is a powerful tool for discouraging challenging behaviour, and encouraging focused learning. Teachers offering specific praise or rewards to students for positive behaviour increases the chances of students showing them.
Practice area 4: Teach learning behaviours alongside managing challenging behaviour (proactive and reactive)
This practice area involves explicitly teaching students positive classroom behaviours like listening to instructions, working well with classmates, monitoring their own behaviour, and persisting with classroom tasks. Setting students up with positive learning behaviours reduces the need to manage challenging behaviour, ensuring that all students are able to engage in class work and achieve in school.
Key teacher practices are:
- using classroom teaching practices that promote focused learning
- providing opportunities to learn positive social behaviours with peers
- coaching and prompting students to regulate their own behaviour.
Why this is important
Teaching and reinforcing learning behaviours reduces the need to manage challenging behaviour. This is because the more engaged and motivated students are, the less likely they are to behave poorly, and the less time teachers need to spend managing behaviour.(72) Once learning behaviours are well-embedded in the classroom, teachers can focus more on teaching planned lessons, rather than responding to behaviour issues. Learning behaviours are key to academic achievement across all students in the class.(73)
Practice area 5: Respond effectively to behaviour (reactive)
This practice area is about teachers being well prepared and feeling confident to respond effectively to challenging behaviour. Having a set of pre-planned responses for common behaviours means teachers can respond efficiently and effectively, preventing the behaviour from escalating. There is a range of responses that teachers can use, ranging from low-level (e.g. corrective feedback) to high-level (e.g. logical consequences).
Key teacher practices are:
- planning responses to common and frequent behaviours in advance
- responding appropriately using relevant strategies, including:
- corrective feedback
- reminders (‘warning’ at secondary school level)
- redirections
- logical consequences.
Why this is important
Occasional challenging behaviour will occur in even in the most well-organised classroom environments. This means that teachers need to be prepared to respond to challenging behaviour, alongside embedding good-quality behaviour expectations and preventative practices. Without immediate and appropriate responses from teachers, challenging behaviours can quickly escalate and present risks to students and school staff.(74)
For less serious behaviours, structured feedback from teachers helps students develop better self-management skills.
For more serious or recurring behaviours, it’s most effective to enforce logical consequences that reinforce agreed rules and expectations are proportional to the student’s behaviour and support all students to know what behaviour is expected at school. Logical consequences should reflect agreed schoolwide practices.(75)
Practice area 6: Use targeted approaches to meet the individual needs of students (reactive)
Targeted approaches are intended for students with the most challenging behaviour. Leaders and teachers work with experts and parents and whānau to plan and implement specific strategies for individual students, that align with the whole-school behaviour management approach. Students will often be involved in the process of developing their own plans.
There are a range of behaviour support available to schools in Aotearoa New Zealand which should be accessed when typical behaviour management strategies are not effective. Schools can draw on expertise from RTLB, Social Workers in Schools (SWIS), counsellors, and through funding programmes such as the interim response fund and Te Kahu Tōi: Intensive Wraparound Service, and other supports.(76)
Key teacher practices are:
- adapting approaches to individual needs, for students with more challenging behaviour
- planning with school staff, the student, their parents and whānau, and others (as required) to address and respond to extreme or persistent behaviour
- getting expert help when required.
Why this is important
A school’s usual approach to behaviour management is designed to prevent and respond to the majority of behaviours in a school, but may be insufficient to meet the needs of the most challenging students. In these cases, a school’s clear expectations and norms around behaviour should form the backbone of a more targeted approach to behaviour management for these individual students.(77)
Targeted approaches are most effective when tailored to students’ needs and the context in which their behaviour is most likely to occur (e.g. during a particular class, activity, or time in the day).(78) When designing targeted approaches, schools also need to consider influences in students’ lives from outside of school.(79) For this reason, it is effective to include parents and whānau, the student themselves and relevant health/psychological professionals in the development of the plan. This allows teachers to match their response with underlying causes and influences on that student’s behaviour.
These six key areas of practice work as a set of effective practices. When teachers and leaders develop proficiency in each of these areas the evidence shows that behaviour and academic achievement improve. For more about these six practice areas see our companion good practice report.
Conclusion
Positive classroom behaviour creates the conditions for all students to focus and achieve. Managing behaviour is not just about supporting one or two students to stop their challenging behaviour – it’s about using a range of proactive and reactive strategies practices to ensure all students in the class are able to do their best work. The six practice areas outlined in this chapter, and detailed in our companion report Good Practice: Behaviour in our Classrooms, make a real difference to classroom behaviour management.
Chapter 8: Findings and areas for action
The five questions we asked for this evaluation have led to 11 key findings that sit across this work. Based on these findings, we have identified five areas for action, which together have the potential to help improve the challenging behaviours in Aotearoa New Zealand classrooms. This section sets out our findings, areas for action, and our recommendations for improvement.
This evaluation has answered five key questions, set out below.
- What are the challenging behaviours teachers face in the classroom?
- How has this changed over time?
- What is the impact of these behaviours on:
- teachers and principals?
- students, and parents and whānau?
- What are the long-term impacts on students of existing responses? (i.e. stand-downs, suspensions, exclusions)
- What does the evidence show are the effective practices?
- How does this look at different stages of the school system?
- What does this look like in practice in NZ schools?
- What needs to be in place to enable good practice?
- How well does the system support schools to manage challenging behaviour?
Our evaluation led to 11 key findings:
Behaviour is a major problem in Aotearoa New Zealand schools, and it is worse than other countries.
- Half of teachers have to deal with students calling out and distracting others in every lesson.
- A quarter of principals see students physically harming others and damaging or taking property every day.
- PISA results over the last 20 years show that Aotearoa New Zealand’s classrooms have consistently had worse behaviour compared to most other OECD countries. For example, Aotearoa New Zealand is lowest among OECD for behaviour in maths classes and in the bottom quarter of PISA countries for behaviour in English classes.
Student behaviour has become worse in the last two years.
- Over half of teachers report all types of behaviour have become worse. In particular, they report a greater number of students displaying challenging behaviour.
Behaviour is significantly damaging student learning and achievement.
- Almost half (47 percent) of teachers spend 40-50 mins a day or more responding to challenging behaviour. This limits the time available to teach.
- Three-quarters of teachers believe student behaviour is impacting on students’ progress.
- International evidence (PISA) links behaviour and achievement, finding students in the most well-behaved maths classes scored significantly higher than all other students, and students in the worst-behaved classes scored the lowest.
Behaviour is significantly impacting student enjoyment of school and therefore attendance.
- Two-thirds of teachers (68 percent) and principals (63 percent) find that challenging behaviour in the classroom has a large impact on student enjoyment. Enjoyment of school is a key driver of attendance.
Behaviour is a key driver of teachers leaving teaching.
- Behaviour impacts on teacher wellbeing through mental health, physical health, and stress.
- Half of teachers (50 percent) say this has a large impact on their intention to stay in the profession.
Behaviour is associated with negative life outcomes.
- Student behaviour is sometimes managed through being stood-down (not allowed to attend school). These students have worse life outcomes.
- Students with three or more stand-downs are less than a third as likely to leave school with NCEA Level 2 (22 percent) than those with no stand-downs (73 percent).
- Experiencing stand-downs is linked to other longer-term outcomes such as unemployment, offending, and poor health.
- The younger a student’s first stand-down, suspension, or exclusion, the more likely they are to receive a benefit, have lower income, have a greater number of admissions to emergency departments, offend, or receive a custodial sentence.
Behaviour issues are particularly severe in large schools and schools in low socioeconomic communities.
- Teachers at larger schools see challenging behaviour more often, such as refusal to follow instructions (75 percent of teachers at large schools see this every day, compared with 65 percent of teachers at small schools).
- Teachers from schools in low socioeconomic communities also see challenging behaviour more often, such as damaging or taking property (40 percent see this at least every day, compared to 23 percent from schools in high socioeconomic communities), reflecting the additional challenges in these communities.
Teachers are not all well prepared to manage behaviour.
- Less than half (45 percent) of new teachers report being capable of managing behaviours in the classroom in their first term.
- Older new teachers (aged 36 and above) are more prepared to manage behaviour in their first term teaching than teachers aged 35 or younger.
Many teachers and principals struggle to access the expert support they need, particularly in secondary schools and schools in low socioeconomic communities.
- Half of teachers (54 percent) and three-quarters of principals (72 percent) find timely advice from experts to be an important support, yet four in 10 (39 percent) teachers and half of principals (49 percent) find it difficult to access.
- Teachers at secondary school feel the least supported, and that their behavioural policies and procedures are the least effective and applied the least consistently.
Teachers struggle to find the time to respond to behaviour.
- Over half of teachers (53 percent) and principals (60 percent) find it difficult to access the time they need to tackle behaviour issues.
There are inconsistencies in behaviour management within schools and between schools.
- One in four teachers (25 percent) report that their school’s behaviour policies and procedures are not applied consistently at their school. But just 2 percent of principals think they are not applied consistently.
Five areas for action
Based on these 11 key findings, ERO has identified five areas that require action to ensure teachers and staff in Aotearoa New Zealand’s English-medium schools are set up to predict and manage challenging classroom behaviours, these are set out below.
- Increase accountability and clear expectations
- Greater prevention
- Raising teachers’ capability
- Greater investment in effective support
- Effective consequences
Cross-cutting: Moving to a national approach.
Recommendation 1: Prioritise classroom behaviour and move to a more national approach to support all schools to prevent, notice, and respond to challenging behaviours effectively. This needs to include a more consistent set of expert supports and programmes for schools, based off a stronger evidence base of what is effective.
Area 1: Increase accountability and set clear expectations
Recommendation 2: ERO to include a sharper focus in its reviews of schools on schools’ behavioural climate, policies, and plans for managing behaviour.
Recommendation 3: Provide national guidance to school boards on clear minimum expectations of the behaviour climate, and for boards to set clear expectations for behaviour across their schools and ensure that these are understood by teachers and parents and whānau.
Area 2: Greater prevention
Recommendation 4: Increase in-school and out-of-school support that identifies and addresses underlying causes of behaviour, e.g. intensive parenting support, access to counselling to reduce anxiety, and support to develop individualised behaviour plans.
Recommendation 5: Examine school size and structures within larger schools – noting that behaviour in large schools is more of a problem than in smaller schools.
Recommendation 6: Support schools to monitor behaviour, identify issues early, and ensure information on prior behaviour is passed between settings (e.g. early learning to schools, primary to secondary).
Recommendation 7: Support schools to adopt evidence-based practices that promote positive behaviour and increase consistency of how behaviour is managed within the school.
Area 3: Raising teachers’ capability
Recommendation 8: Increase the focus on managing behaviour as part of Initial Teacher Education (building on the practice of the Initial Teacher Education providers who do this well) and within the first two years of induction of beginning teachers, and within the Teaching Standards (Teaching Council).
Recommendation 9: Increase recruitment of more mature Initial Teacher Education students who are better able to manage behaviour.
Recommendation 10: Prioritise evidence-based professional learning and development for teachers on effective approaches to managing behaviour and consider nationally accredited professional learning and development.
Area 4: Greater investment in effective support
Recommendation 11: Increase availability of specialist support for students (e.g. educational psychologists, this will require increasing supply).
Recommendation 12: Identify and grow the most effective (and value for money) supports and programmes and embed these consistently in all schools, including evaluating the effectiveness of current programmes (such as Positive Behaviour for learning).
Recommendation 13: Review the learning support workforce and funding models to ensure schools and teachers can access the right supports at the right time.
Recommendation 14: Prioritise support for schools with the largest behavioural issues, including larger schools and schools in low socioeconomic communities.
Area 5: Effective consequences
Recommendation 15: Provide clear guidance to schools on what the most effective consequences for challenging behaviour are and how to use them to achieve the best outcomes for students.
Recommendation 16: Ensure suspensions remain a last resort and that they trigger individual behaviour plans and the support needed for successful changes of behaviour.
Conclusion
In order to shift the significant behaviour issue in Aotearoa New Zealand, decisive action is needed. ERO is recommending the creation of a clear package to deliver needed change.
Shifting to a more national approach underpins these recommendations, with increased accountability and expectations for schools and school boards. Additionally, our recommendations outline a greater focus on preventing behavioural issues through both systematic and in-school measures. Increasing teacher capability through effective ITE, teaching standards, recruitment, and PLD will allow teachers to be more confident in managing challenging classroom behaviours.
Across these actions is the need for greater investment in effective supports, embedding these supports, and targeting the most in-need schools as a priority.
Our final action area is focused on providing clear guidance on effective consequences for challenging behaviour and setting out clear processes for using them.
ERO’s recommendations are designed to better support teachers and staff for effective behaviour management in the classroom, for the benefit of themselves and Aotearoa New Zealand’s students.
Useful resources
There are a range of useful resources available for leaders and teachers around supporting student behaviour. Some key resources are linked below.
|
What is it? |
Link |
|
The Education Endowment Foundation’s 2021 resources on Improving Behaviour in Schools |
Improving Behaviour in Schools | EEF (educationendowmentfoundation.org.uk) |
|
ERO’s 2022 report on the experiences of disabled learners in schools |
Thriving at school? Education for disabled learners in schools (ero.govt.nz) |
|
ERO’s 2022 and 2023 attendance reports |
Missing Out: Why Aren’t Our Children Going to School? (ero.govt.nz) |
|
The Ministry of Education’s information page about behaviour resources |
Learning and behaviour supports for schools and kaiako – Education in New Zealand (www.education.govt.nz) |
|
The Ministry of Education’s severe behaviour service resource page |
Behaviour Support - Information for teachers and schools – Education in New Zealan (www.education.govt.nz) |
|
The ‘Educultural Wheel’ framework, developed by Angus MacFarlane for use in Aotearoa New Zealand schools |
|
|
ERO’s 2019 evaluation on bullying in our schools, and companion ‘student voice’ report |
Bullying Prevention and Response in New Zealand Schools.pdf (ero.govt.nz) Bullying Prevention and Response: Student Voice | Education Review Office (ero.govt.nz) |
Appendix 1: Methodology
ERO used a mixed method approach. This report draws on survey and administrative data, site visits to schools, as well as the voices of teachers, principals, support staff, RTLBs, students, parents and whānau, and sector experts to understand behaviour in the classroom, its impacts, and strategies to improve classroom behaviour
This section covers:
- design
- analysis
- principal Survey
- teacher survey
- site visits and focus groups
Design
ERO used a mixed method approach for this report. We collected both qualitative and quantitative data. The target population was teachers, principals, and students in English-medium schools in Aotearoa New Zealand. We also talked to parents and whānau and experts. Data was collected through surveys, focus groups and site visits.
When designing both survey and focus group questions, we undertook an in-depth review of literature on evidence-based practices for managing behaviour in the classroom, including Education Endowment Foundation research.
Analysis
Quantitative survey analysis
Quantitative data was statistically analysed using STATA and Excel software. Differences between groups were identified through non-parametric statistical tests. Where we report differences for groups these are significant at p < 0.05. Non-responses and ‘don’t know’ responses were excluded from response totals when calculating percentages and running statistical tests.
Numbers and percentages are rounded to the nearest full number, except where rounding errors lead to incorrect totals. In these instances, the numbers are rounded to minimise rounding error.
Quantitative Integrated Data Infrastructure analysis
This work was carried out by the Social Wellbeing Agency and explored the long-term outcomes of stand-downs, suspensions and exclusions, using Statistics New Zealand’s Integrated Data Infrastructure (IDI). The IDI is a secure research database that brings together anonymised data collected by government agencies, including records from the education, health, criminal justice, tax, and care and protection systems.
The sample covered people born between 1990 to 2004 (inclusive). This covers a total of 789,015 people, of which 104,574 had at least one stand-down, 23,247 had at least one suspension, and 13,827 had at least one exclusion. The population was restricted to the Administrative Population Census population in the IDI. For more about the derivation of this population see appendix 1 of the Experimental administrative population census: Data sources, methods, and quality (second iteration), pp. 36-37.(80)
The sample population was followed from age 17 to 30, with the upper bound depending on the age of the person in 2021. Education data on stand-downs, suspensions, and exclusions, as well as cross-government data on later life outcomes were joined to this population table. For definitions of the variables followed longitudinally, see the appendix of the 2023 report Experiences and outcomes of Alternative Education participants, table A1 pp. 45-46.(81)
This analysis compares, without adjustment, students who have received stand-downs, suspensions and exclusions to students who have not received these interventions. There are variables that correlate with the students likelihood of having an intervention that also correlate with the later life outcomes analysed in this work. To name a few examples, the ongoing impacts of colonisation, undiagnosed mental health disorders, and experiences of family violence. For this reason, differences in later life outcomes between students who experience and do not experience stand-downs, suspensions, or exclusions should not be interpreted as being necessarily caused by the stand-down, suspension, or exclusion.
Qualitative analysis
Qualitative data were analysed by an experienced team. All focus groups were recorded, and extensive notes were taken. Following each focus group, interviewers immediately sorted information into predetermined domains (adjusting and creating more as needed), and useful quotes were identified and documented from verbatim records.
Review of good practice literature
As part of developing our practice areas and key practices, we reviewed the local and international literature on good practice for managing challenging behaviour. This included research conducted by the Education Endowment Foundation. Our refined practice areas are the result of combining analysis of the literature, with input from experts. These practice areas formed the framework for sorting and analysis of our site visit and focus group data into collections of ‘real-life strategy’ examples.
Sense-making
Following analysis of the data from the surveys and focus groups, sense-making discussions were conducted to test interpretation of the results, findings, and recommendations with:
→ ERO specialists in reviewing school practice
→ the project’s Expert Advisory Group, made up of sector experts
→ the project’s Steering Group.
We then tested and refined the findings and recommendations with the following organisations to ensure they were useful and practical:
→ Ministry of Education
→ Whaikaha | Ministry of Disabled People
→ peak bodies e.g. teacher unions, principals’ networks
→ Deans of education
→ ERO’ principals advisory group.
Principal survey
ERO conducted the principal survey using Survey Monkey. The principal survey was in the field from 31 of August 2023 to 16 October 2023 (spanning parts of Term 3, the term break and Term 4). We emailed all principals to participate in our survey, excluding principals of Māori-medium and private schools. Principals were sent the survey link in an email. We sent the survey to 2258 schools, and we had a total of 547 principal respondents. No weighting was applied to the responses. A full list of survey questions we asked can be found in Appendix 2.
Below is a breakdown of principal participants and population statistics from Education Counts:(82)
|
Demographic |
Number |
Percentage of participants |
Principal population percentages |
|
Māori |
67 |
12% |
19% |
|
Non-Māori |
480 |
88% |
81% |
|
Pacific |
26 |
5% |
3% |
|
Non-Pacific |
521 |
95% |
97% |
|
Female |
360 |
66% |
56% |
|
Male |
183 |
33% |
44% |
|
Gender diverse |
0 |
0% |
(not listed) |
|
Prefer not to say |
4 |
1% |
(not listed) |
|
Main urban |
294 |
55% |
53% |
|
Secondary urban |
40 |
8% |
6% |
|
Minor urban |
67 |
13% |
12% |
|
Rural |
130 |
24% |
28% |
|
Primary |
420 |
79% |
75% |
|
Intermediate |
30 |
6% |
5% |
|
Secondary |
420 |
15% |
20% |
|
Low socioeconomic communities |
98 |
20% |
25% |
|
High socioeconomic communities |
132 |
28% |
25% |
Teacher survey
ERO conducted the teacher survey using Survey Monkey. The teacher survey was in the field from 31 of August 2023 to 16 October 2023 (spanning parts of Term 3, the term break and Term 4). At the same time that we emailed all principals to participate in our survey (excluding principals of Māori-medium and private schools) and we asked them to pass on the teacher survey link to their teachers. We had a total of 1557 teacher respondents. No weighting was applied to the responses. A full list of survey questions we asked can be found in Appendix 3
Below is a breakdown of the teacher participants and the population statistics from education counts:(83)
|
Demographic |
Number |
Percentage of participants |
Teacher population percentages |
|
Māori |
202 |
13% |
13% |
|
Non-Māori |
1350 |
87% |
87% |
|
Pacific |
53 |
3% |
5% |
|
Non-Pacific |
1499 |
97% |
95% |
|
Female |
1169 |
75% |
76% |
|
Male |
356 |
23% |
24% |
|
Gender diverse |
7 |
<1% |
<1% |
|
Prefer not to say |
19 |
1% |
(not listed) |
|
Main urban |
983 |
67% |
73% |
|
Secondary urban |
96 |
6% |
7% |
|
Minor urban |
233 |
16% |
12% |
|
Rural |
165 |
11% |
9% |
|
Primary |
597 |
40% |
48% |
|
Intermediate |
67 |
5% |
6% |
|
Secondary |
811 |
55% |
45% |
Site visits and focus groups
ERO talked to 47 school staff, 37 students, 21 parents and whānau participants, 14 Resource Teachers: Learning and Behaviour (RTLBs) from two clusters through focus groups. These were held in person or over Zoom. We conducted these between August 2023 and December 2023. Focus groups were run as flexible, semi-structured discussions. Different combinations of team members conducted interviews, following a set protocol. Focus groups were always undertaken in pairs.
Information and consent
All focus group participants were informed of the purpose of the evaluation before they agreed to participate. Participants were informed that:
→ participation was voluntary and could be withdrawn at any time
→ permission to use their information could be withdrawn at any time
→ focus groups were not an evaluation of their school, and their school would not be identified in the resulting national report
→ their information was confidential and would be kept securely subject to the provisions of the Official Information Act 1982, Privacy Act 1993, and the Public Records Act 2005 on the release and retention of information.
Focus group members consented their participation to the focus group via email and by submitting a written consent form to ERO. Their verbal consent was also sought to record their focus groups.
School staff and students
Schools displaying good practice managing behaviour were identified and recommended by expert ERO Evaluation Partners and other stakeholders such as principal associations, to create a short-list of focus groups. Schools were then contacted and recruited by the research team. Schools were given a choice of being visited in person or attending the focus group online. For schools we visited in person, we also held a focus group with students. Schools that we talked to online only included a focus group with staff. Schools had the choice of selecting the participants for the focus groups. We made sure to conduct a student focus group with only Māori students which was conducted by an expert Māori interviewer.
The questions we asked staff are below. We allowed schools to select three domains in advance that we would ask them about.
Introduction questions (asked to all):
- Can you tell us about the top three most common challenging behaviours that you are seeing in the classroom?
- Can you tell us about any changes you are seeing since you started teaching, e.g. the type and level of challenging behaviours?
- Is this frequency or severity? More from the same students/ larger number of students
- Why?
- Can you tell us about anything that has worked well to minimise the impact these behaviours are having on any of these groups?
- you
- colleagues/other school staff
- the classroom
- the student (and other students)
- parents and whānau?
Domain 1:
- Can you tell us about any ways that you organise your classroom to support positive behaviours, that you’ve found particularly successful?
- Can you tell us about any visual behaviour supports you display around your classroom that you’ve found particularly successful?
- What supports need to be in place for you to do these strategies well?
Domain 2:
- Can you tell us about your most successful deliberate strategies for supporting class engagement?
- Getting to know your students, their parents and families/whānau to inform understandings of the influences on their behaviour can be useful. Have you found any particularly effective ways of making this happen? How do you make this happen?
- How do you use specific behaviour-related praise, incentives, and/or rewards throughout lessons?
- Do you collaboratively develop behavioural expectations with students?
- What does this look like?
- How does this work?
- Have you found any good ways to facilitate positive social connections and friendships between students, that help with their behaviour?
- What supports need to be in place for you to do these strategies well?
Domain 3:
- When a challenging behaviour occurs, what are some ways that you respond? Do you have any tips and tricks to share with other teachers?
- Can you think of a recent time where there was challenging behaviour, and you feel like you responded well? –Tell us about that time.
- Are your responses to challenging behaviour something that you plan in advance? If so, tell us about that.
- What supports need to be in place for you to do these strategies well?
Domain 4:
- How do you support individual students who display severe challenging behaviours?
- Could you tell us about a student, the approaches/strategies used, and the impact/outcome?
Domain 5:
- How are you/school staff supported in your practice to develop effective strategies for managing challenging behaviour?
- Are there clear schoolwide expectations, which are reflected in documented policies and procedures?
- Does your school use data to monitor, evaluate and inform improvements in school behaviour approaches?
- Are teachers encouraged to reflect on their own approach, try new approaches, and review impacts of approaches over time? If so – what does this look like?
- Does your school use data to consider how behaviour approaches impact on different groups? (e.g., ethnicities)
- Does your school have behaviour supports that respond to students’ cultures and identities? (if so, describe how)
The questions we asked students were:
- Have you had situations in your class where you have seen your peers/other students show challenging behaviour? What kinds of behaviour?
- How does your teacher set up a positive culture/environment in the classroom?
- This might be things like:
- the way the classroom is set up
- reminders on the wall
- having routines.
- How does your teacher encourage you to behave well?
- This might be things like
- coming up with expectations together
- praise
- incentives
- getting to know you.
- What kinds of strategies (things) does the teacher use (do) to help you with your behaviour and learning?
- An example?
- Is there a particular teacher who does this well? Tell us more about this.
- This might be things like
- This might be things like:
Parents and whānau
We conducted four parent focus groups with 21 participants in total. These were all held online. We recruited a sample of parents through a panel company which included a mix of male and females, parents of different aged children and from a geographical spread. We also ensured we had a range of ethnic representation and boosted Māori and Pacific participants. Māori ERO staff conducted specific focus groups with just Māori whānau and we had an option of a specific focus group for Pacific parents only. Focus groups were conducted during October 2023.
The guiding questions for parents and whānau focus groups were:
- Contextual information – How many children do you have? How old/what year level are they? Do you have any children with (complex/challenging) behaviour needs?
- What kinds of challenging behaviours do you know are impacting your child in their classroom? How often are these happening?
- Have you got some specific examples/experiences? Tell us about these. (Also asked about the specific impact)
- When those behaviours happen how do they affect your child/children, yourself, and school staff?
- When those behaviours happen can you tell us about any strategies that the school has used that have been helpful for all the children?
- What do you know about the school’s behaviour policies and procedures?
- At your child’s school do you know of any other positive strategies or approaches to dealing with challenging behaviour that you would like to share with us (do you think these are consistently used)?
RTLBs
We conducted two focus groups with RTLBs from two clusters. These were recruited through conversations with experts. We asked the same questions to RTLBs as we did to school staff. We talked to 14 RTLBs in total.
Limitations
As with all research, there are some limitations to our methodology and methods.
In terms of scope, this research:
- does not examine behaviours outside of the classroom where they don’t relate to behaviours in the classroom
- does not touch on bullying behaviours.
In terms of the data collection:
- Principal survey: Since participation was voluntary, it is possible that there was a non-response bias. To address this risk, we sent the survey to all principals on record to ensure maximum reach and held the survey open for a long duration.
- Teacher survey: We distributed our surveys to teachers through emailing principals and asking them to pass the survey link on. This could have influenced the survey respondents as principals could have decided whether or not to pass on the link to their teachers. It’s possible that this resulted in teachers from certain types of schools being more likely to have received the link form their principals. To mitigate this, we sent these emails out to all principals to maximise reach and monitored the representatives of the survey respondents as responses came in to ensure there wasn’t a clear bias.
- Focus groups: We were mainly interested in finding out what was working well for schools managing behaviour. To gather examples of strategies that work we intentionally went to schools that were known to be doing this well. This meant that the qualitative data we collected from schools was not representative of all schools’ experiences. Additionally, it is also possible participants provided socially desirable responses in the interviews. We mitigated this risk by ensuring that all data would be treated confidentially, and no identifiable information would be disclosed.
In terms of data presentation:
Survey data is sometimes simplified for readability. In our survey analysis we use all levels of the Likert responses to draw conclusions about statistically significant differences. In some cases we have, for simplicity, only presented percentages in text or in graphs containing responses to just the top two or bottom two options. This is to highlight the responses we have observed amongst different respondent groups; but the differences we comment on are always a reflection of statistically significant differences in how they responded across the whole ordinal Likert scale.
Appendix 2: Principal survey
Demographic questions
- What is your ethnicity? (tick all that apply)
- African
- Cook island Māori
- Fijian
- Indian
- Latin American
- Māori
- Niuean
- NZ European
- Other Asian
- Other ethnicity
- Other European
- Other Pacific people
- Samoan
- South East Asian
- Tongan
- Don’t know
- Prefer not to say
- What do you identify as?
- Female
- Male
- Gender diverse
- Prefer not to say
- Prefer to self-identify (please specify)
- What is your age?
- Less than 36
- 36 – 45 years
- 46 – 55 years
- 55+ years
- Prefer not to say
- How long have you been a principal?
- Less than 1 year
- 1-2 years
- 3-5 years
- 6-9 years
- 10+ years
- Prefer not to say
- What Education Region is your school in? [region drop-down options]
- What school do you work at? [school drop-down options]
Frequency of challenging behaviour questions
For this question, respondents could select from: At least every lesson/hour, at least every day, at least every week, at least every month, at least every term, every year or less, or don’t know.
- How often are these behaviours happening in your school?
- Challenging verbal behaviours (e.g., calling out, shouting, unauthorised talking to other students)
- Challenging physical behaviours (e.g., hitting, punching, biting, kicking)
- Refusal to follow classroom rules or instructions (e.g., being off-task, ignoring requests, unauthorised moving around the room)
- Behaviours that distract from learning (e.g., pulling faces, unauthorised use of their phone/device, attempting to distract others)
- Behaviours that impact property (e.g., intentionally breaking classroom items, taking other people’s items without consent, using classroom items without permission)
Change in challenging behaviours
For this question, respondents could select from: much worse, worse, about the same, better, much better, or don’t know.
- We are interested in how these types of behaviours are changing over time. Please indicate how these behaviours are now compared to 2 years ago (or when you became a principal if that was less than 2 years ago)
- Challenging behaviour overall
- Challenging verbal behaviours (e.g., calling out, shouting, unauthorised talking to other students)
- Challenging physical behaviours (e.g., hitting, punching, biting, kicking)
- Refusal to follow classroom rules or instructions (e.g., being off-task, ignoring requests, unauthorised moving around the room)
- Behaviours that distract from learning (e.g., pulling faces, unauthorised use of their phone/device, attempting to distract others)
- Behaviours that impact property (e.g., intentionally breaking classroom items, taking other people’s items without consent, using classroom items without permission)
Tick all that apply questions
For these questions, respondents could select from:
- I am seeing these behaviours from a greater number of students
- I am seeing these behaviours more often from the same students
- I am seeing more severe types of these behaviours
- These behaviours have become worse in other ways (please specify)
- Thinking about Challenging behaviour overall. In what ways has behaviour become worse? [tick all that apply]
- Thinking about Challenging verbal behaviours (e.g., calling out, shouting, unauthorised talking to other students). In what ways have these behaviours become worse? [tick all that apply]
- Thinking about Challenging physical behaviours (e.g., hitting, punching, biting, kicking). In what ways have these behaviours become worse? [tick all that apply]
- Thinking about Refusal to follow classroom rules of instructions (e.g., being off-task, ignoring requests, unauthorised moving around the room). In what ways have these behaviours become worse? [tick all that apply]
- Thinking about Behaviours that distract from learning (e.g., pulling faces, unauthorised use of their phones/device, attempting to distract others). In what ways have these behaviours become worse? [tick all that apply]
- Thinking about Behaviours that impact property (e.g., intentionally breaking classroom items, taking other people’s items without consent, using classroom items without permission). In what ways have these behaviours become worse? [tick all that apply]
Multichoice questions
- How big of an impact does challenging behaviour in the classroom have on your school staff’s stress?
- No impact
- Very small
- Small
- Medium
- Large
- Very large
- Don’t know
- How supported by the school do you feel your school staff are to manage the challenging behaviours in the classroom?
- Very unsupported
- Unsupported
- Somewhat unsupported
- Somewhat supported
- Supported
- Very supported
- Don’t know
Open text question
- What are the top ways you support staff to manage challenging behaviour?
Further multichoice question
- In an average week, how much of your time do you spend responding to challenging behaviour?
- Less than an hour (averaging less than 10 mins a day)
- Between 1 and 3 hours (averaging 15-30 mins a day)
- Between 3 and 5 hours (averaging 40-50 mins a day)
- Between 5 and 7 hours (averaging more than an hour a day)
- Between 7 and 10 hours (averaging more than 1.5 hours a day)
- Over 10 hours (averaging more than 2 hours a day)
Size of impact questions
For this question, respondents could select from: no impact, very small, small, medium, large, very large, don’t know.
- How big of an impact does challenging behaviour at your school have on your own…
- Stress
- Enjoyment of the job
Extent of impact questions
For this question, respondents could select from: very small extent, small extent, medium extent, large extent, very large extent, don’t know.
- Thinking about the students in your school, to what extent does challenging behaviour in the classroom affect their…
- Learning progress
- Enjoyment of learning
Further multichoice questions
- My school’s behaviour management policies and procedures are…
- Very ineffective
- Ineffective
- Somewhat ineffective
- Somewhat effective
- Effective
- Very effective
- My school doesn’t have this
- Don’t know
- My school’s behaviour management policies and procedures are applied consistently throughout the school.
- Strongly disagree
- Disagree
- Somewhat disagree
- Somewhat agree
- Agree
- Strongly agree
- Don’t know
Importance questions
For this question, respondents could select from: not important at all, not important, somewhat not important, somewhat important, important, very important, don’t know.
- How important are the following to your school/s ability to manage challenging behaviour?
- Legislation, guidelines, and rules
- Behaviour support programmes (e.g. Positive Behaviour for Learning or other programmes)
- Specialist support from external agencies (e.g. referrals, RTLBs, or intensive wrap-around services)
- Timely advice from experts and external agencies or others
- Professional learning and development
- Time to tackle behavioural issues
Difficulty of access questions
For this question, respondents could select from: very difficult, difficult, somewhat difficult, somewhat easy, easy, very easy, don’t know.
- Currently, how easy is it for you to use/access the following supports to manage challenging behaviour?
- Legislation, guidelines, and rules
- Behaviour support programmes (e.g. Positive Behaviour for Learning or other programmes)
- Specialist support from external agencies (e.g. referrals, RTLBs, or intensive wrap-around services)
- Timely advice from experts and external agencies or others
- Professional learning and development
- Time to tackle behavioural issue
Open text question
- Is there anything else you would like to tell us about managing challenging behaviour?
Appendix 3: Teacher survey
Demographic questions
- What is your ethnicity? (tick all that apply)
- African
- Cook island Māori
- Fijian
- Indian
- Latin American
- Māori
- Niuean
- NZ European
- Other Asian
- Other ethnicity
- Other European
- Other Pacific people
- Samoan
- South East Asian
- Tongan
- Don’t know
- Prefer not to say
- What do you identify as?
- Female
- Male
- Gender diverse
- Prefer not to say
- Prefer to self-identify (please specify)
- What is your age?
- Less than 36
- 36 – 45 years
- 46 – 55 years
- 55+ years
- Prefer not to say
- How long have you been teaching?
- Less than 1 year
- 1-2 years
- 3-5 years
- 6-9 years
- 10+ years
- Prefer not to say
- What Education Region is your school in? [region drop-down options]
- What school do you work at? [school drop-down options]
Frequency of challenging behaviour questions
For this question, respondents could select from: At least every lesson/hour, at least every day, at least every week, at least every month, at least every term, every year or less, or don’t know.
- How often are these behaviours happening in your class?
- Challenging verbal behaviours (e.g., calling out, shouting, unauthorised talking to other students)
- Challenging physical behaviours (e.g., hitting, punching, biting, kicking)
- Refusal to follow classroom rules or instructions (e.g., being off-task, ignoring requests, unauthorised moving around the room)
- Behaviours that distract from learning (e.g., pulling faces, unauthorised use of their phone/device, attempting to distract others
- Behaviours that impact property (e.g., intentionally breaking classroom items, taking other people’s items without consent, using classroom items without permission)
Change in challenging behaviours
For this question, respondents could select from: much worse, worse, about the same, better, much better, or don’t know.
- We are interested in how these types of behaviours are changing over time. Please indicate how these behaviours are now compared to 2 years ago (or when you started teaching if that was less than 2 years ago)
- Challenging behaviour overall
- Challenging verbal behaviours (e.g., calling out, shouting, unauthorised talking to other students)
- Challenging physical behaviours (e.g., hitting, punching, biting, kicking)
- Refusal to follow classroom rules or instructions (e.g., being off-task, ignoring requests, unauthorised moving around the room)
- Behaviours that distract from learning (e.g., pulling faces, unauthorised use of their phone/device, attempting to distract others)
- Behaviours that impact property (e.g., intentionally breaking classroom items, taking other people’s items without consent, using classroom items without permission)
Tick all that apply questions
For these questions, respondents could select from:
- I am seeing these behaviours from a greater number of students
- I am seeing these behaviours more often from the same students
- I am seeing more severe types of these behaviours
- These behaviours have become worse in other ways (please specify)
- Thinking about Challenging behaviour overall. In what ways has behaviour become worse? [tick all that apply]
- Thinking about Challenging verbal behaviours (e.g., calling out, shouting, unauthorised talking to other students). In what ways have these behaviours become worse? [tick all that apply]
- Thinking about Challenging physical behaviours (e.g., hitting, punching, biting, kicking). In what ways have these behaviours become worse? [tick all that apply]
- Thinking about Refusal to follow classroom rules of instructions (e.g., being off-task, ignoring requests, unauthorised moving around the room). In what ways have these behaviours become worse? [tick all that apply]
- Thinking about Behaviours that distract from learning (e.g., pulling faces, unauthorised use of their phones/device, attempting to distract others). In what ways have these behaviours become worse? [tick all that apply]
- Thinking about Behaviours that impact property (e.g., intentionally breaking classroom items, taking other people’s items without consent, using classroom items without permission). In what ways have these behaviours become worse? [tick all that apply]
Multichoice questions
- In an average week, how much class time do you spend responding to challenging behaviours?
- Less than an hour (averaging less than 10 mins a day)
- Between 1 and 3 hours (averaging 15-30 mins a day)
- Between 3 and 5 hours (averaging 40-50 mins a day)
- Between 5 and 7 hours (averaging more than an hour a day)
- Between 7 and 10 hours (averaging more than 1.5 hours a day)
- Over 10 hours (averaging more than 2 hours a day)
For this question, respondents could select from: no impact, very small, small, medium, large, very large, don’t know.
- How big of an impact does challenging behaviour in the classroom have on your…
- Stress
- Mental health
- Physical health
- Enjoyment of the job
- Intention to continue as a teacher
- How confident are you to manage the challenging behaviours in your classroom?
- Not confident at all
- Not confident
- Somewhat not confident
- Somewhat confident
- Confident
- Very confident
- Don’t know
- How well are you coping with managing the challenging behaviours in your classroom?
- Very poorly
- Poorly
- Somewhat poorly
- Somewhat well
- Well
- Very well
- Don’t know
- How supported do you feel by your school to manage the challenging behaviours in your classroom?
- Very unsupported
- Unsupported
- Somewhat unsupported
- Somewhat supported
- Supported
- Very supported
- Don’t know
- Which of the following supports do you find most valuable for managing challenging behaviour?
- Support from school leaders
- Peer support and advice
- Professional learning programmes and courses
- Professional readings
- Social media groups
- Observations of other teachers
- Coaching/mentoring
- Other (please specify)
Extent of impact questions
For this question, respondents could select from: very small extent, small extent, medium extent, large extent, very large extent, don’t know.
- Thinking about your students, to what extent does challenging behaviour in the classroom affect their…
- Learning progress
- Enjoyment of learning
Further multichoice questions
- My school’s behaviour management policies and procedures are…
- Very ineffective
- Ineffective
- Somewhat ineffective
- Somewhat effective
- Effective
- Very effective
- My school doesn’t have this
- Don’t know
- My school’s behaviour management policies and procedures are applied consistently throughout the school.
- Strongly disagree
- Disagree
- Somewhat agree
- Agree
- Strongly agree
- Don’t know
Importance questions
For this question, respondents could select from: not important at all, not important, somewhat not important, somewhat important, important, very important, don’t know.
- How important are the following supports for manage challenging behaviour at your school?
- Legislation, guidelines, and rules
- Behaviour support programmes (e.g. Positive Behaviour for Learning or other programmes)
- Specialist support from external agencies (e.g. referrals, RTLBs, or intensive wrap-around services)
- Timely advice from experts and external agencies or others
- Professional learning and development
- Time to tackle behavioural issues
Difficulty of access questions
For this question, respondents could select from: very difficult, difficult, somewhat difficult, somewhat easy, easy, very easy, don’t know.
- Currently, how easy is it for you to use/access the following supports to manage challenging behaviour?
- Legislation, guidelines, and rules
- Behaviour support programmes (e.g. Positive Behaviour for Learning or other programmes)
- Specialist support from external agencies (e.g. referrals, RTLBs, or intensive wrap-around services)
- Timely advice from experts and external agencies or others
- Professional learning and development
- Time to tackle behavioural issue
Open text question
- Is there anything else you would like to tell us about managing challenging behaviour?
References
- [1] Centre for Education Statistics and Evaluation. (n.d.). Classroom management: Creating and maintaining positive learning environments. New South Wales Department of Education. https://education.nsw.gov.au/content/dam/main-education/about-us/educational-data/cese/2020-classroom-management-literature-review.pdf
Korpershoek, H., et al. (2019). The Relationships between School Belonging and Students' Motivational, Social-Emotional, Behavioural, and Academic Outcomes in Secondary Education: a Meta-Analytic Review. Papers in Education. 35, 641–680. doi:10.1080/02671522.2019.1615116
- [1] Ministry of Education. (n.d.). Behaviour and learning. TKI. https://inclusive.tki.org.nz/guides/behaviour-and-learning/#foster-positive-relationships-and-partnerships
- [1] Nwoko, J. C., et al. (n.d.). A Systematic Review of the Factors That Influence Teachers’ Occupational Wellbeing. International Journal of Environmental Research and Public Health, 20(12). https://www.ncbi.nlm.nih.gov/pmc/articles/PMC10298565/
- [1] Centre for Education Statistics and Evaluation. (n.d.). Classroom management: Creating and maintaining positive learning environments. New South Wales Department of Education. https://education.nsw.gov.au/content/dam/main-education/about-us/educational-data/cese/2020-classroom-management-literature-review.pdf
- [1] Sugai, G., & Horner, R. H. (2009). Defining and Describing Schoolwide Positive Behavior Support. In Handbook of Positive Behavior Support. Springer. https://link.springer.com/chapter/10.1007/978-0-387-09632-2_13#citeas
- [1] Ministry of Education. (n.d.). Stand-downs, suspensions, exclusions and expulsions guidelines – Part 1. https://www.education.govt.nz/school/managing-and-supporting-students/student-behaviour-help-and-guidance/stand-downs-suspensions-exclusions-and-expulsions-guidelines/principals-role/principals-decision/
- [1] (Education and Training Act 2020)
- [1] Ministry of Education. (n.d.). Stand-downs, suspensions, exclusions and expulsions guidelines – Part 1. https://www.education.govt.nz/school/managing-and-supporting-students/student-behaviour-help-and-guidance/stand-downs-suspensions-exclusions-and-expulsions-guidelines/principals-role/principals-decision/
- [1] Education Counts. (n.d.). Stand-downs, suspensions, exclusions and expulsions from school. Retrieved February 2024, from https://www.educationcounts.govt.nz/statistics/stand-downs,-suspensions,-exclusions-and-expulsions
- [1] Medina, E. (2023). PISA 2022: Mathematics achievement and experiences of 15-year-olds. Ministry of Education. https://www.educationcounts.govt.nz/__data/assets/pdf_file/0005/224609/PISA-2022-Mathematics-achievement-and-experiences-report.pdf
- [1] Sturrock, F., May, S., & Comparative Education Research Unit, Ministry of Education. (2002). PISA 2000: The New Zealand context. Education Counts. https://www.educationcounts.govt.nz/publications/series/2543/PISA_2000/5275
- [1] Ministry of Education. (2002). PISA 2000: Overview of selected New Zealand Findings]. https://www.educationcounts.govt.nz/__data/assets/pdf_file/0020/7508/PISA-2000-Overview-of-selected-New-Zealand-findings.pdf
- [1] Ministry of Education. (2003). Learning for tomorrow’s world: Programme for international student assessment (pisa) 2003 - New Zealand summary report. https://www.educationcounts.govt.nz/__data/assets/pdf_file/0003/6987/PISA-2003-Learning-for-tomorrows-world-New-Zealand-Summary-Report.pdf
- [1] Telford, M. (n.d.). PISA 2009 reading to learn: New Zealand 15-year-olds’ reading habits, learning approaches and experiences of teaching practices. Ministry of Education. https://www.educationcounts.govt.nz/__data/assets/pdf_file/0013/116203/PISA-2009-Reading-to-Learn-Part-1.pdfhttps://www.educationcounts.govt.nz/__data/assets/pdf_file/0013/116203/PISA-2009-Reading-to-Learn-Part-1.pdf
- [1] (2009). Reading to learn. Https://Www.educationcounts.govt.nz/__data/Assets/Pdf_file/0014/116204/PISA-2009-Reading-To-Learn-Part-2.Pdf.
- [1] Lamy, M., & May, S. (2012). PISA 2012 series on the learning environment, volume iii: student behaviour. Ministry of Education. https://www.educationcounts.govt.nz/__data/assets/pdf_file/0018/146205/PISA-2012-Series-on-the-Learning-Environment-Vol-III-Student-Behaviour.pdf
- [1] Jang-Jones, A., & McGregor, A. (2019). PISA 2018 New Zealand students’ wellbeing school climate & student mindsets of 15-year-old. https://www.educationcounts.govt.nz/__data/assets/pdf_file/0005/196628/PISA-2018-NZ-Students-Wellbeing.pdf
- [1] Medina, E. (2023). PISA 2022: Mathematics achievement and experiences of 15-year-olds. Ministry of Education. https://www.educationcounts.govt.nz/__data/assets/pdf_file/0005/224609/PISA-2022-Mathematics-achievement-and-experiences-report.pdf
- [1] Leete, N. S. (2022). New Zealand secondary school principals’ understanding and application of laws relating to student discipline: a socio-legal mixed methods study.https://ir.canterbury.ac.nz/server/api/core/bitstreams/8d3a5fb1-48d5-4581-b6bd-229b4b33488c/content
- [1] Education Counts. (n.d.). Stand-downs, suspensions, exclusions and expulsions from school. Retrieved February 2024, from https://www.educationcounts.govt.nz/statistics/stand-downs,-suspensions,-exclusions-and-expulsions
- [1] Acar, I. H., et al. (2022). Can You See Me at My Worst? A Latent Profile Analysis Of Students And Teachers’ Perceptions Of Student Behavior Problems. Current Psychology, 42(7).
- [1] Gateways School. (n.d.). Benefits of having a small school community. https://www.gatewaysschool.co.uk/benefits-small-school-community/
- [1] Manpower Demonstration Research Corporation. (n.d.). New York City Small Schools of Choice Evaluation. https://www.mdrc.org/work/projects/new-york-city-small-schools-choice-evaluation#featured_content
- [1] The Research Alliance for New York City Schools. (n.d.). Understanding the impact of small high schools of choice. NYU Steinhardt. https://steinhardt.nyu.edu/research-alliance/research/projects/understanding-impact-small-high-schools-choice
- [1] Bloom, H. S., & Unterman, R. (2014). Can Small High Schools of Choice Improve Educational Prospects for Disadvantaged Students?. Journal of Policy Analysis and Management, 33(2). https://www.researchgate.net/publication/260531250_Can_Small_High_Schools_of_Choice_Improve_Educational_Prospects_for_Disadvantaged_Students/citation/download
- [1] Barry, A. et al. (2017). Trade offs and solutions: investigating survival strategies and decision-making to mediate the effects of poverty in whānau. https://www.otago.ac.nz/__data/assets/pdf_file/0030/332499/trade-offs-and-solutions-investigating-survival-strategies-and-decision-making-to-mediate-the-effects-of-poverty-in-whanau-640012.pdf
- [1] Flouri, E., & Midouhas, E. (2016). School Composition, Family Poverty and Child Behaviour. Social Psychiatry and Psychiatric Epidemiology, 51(6), 817–826. https://www.ncbi.nlm.nih.gov/pmc/articles/PMC4889629/
Letourneau, N. L. et al. (2013). Socioeconomic Status and Child Development: A Meta-Analysis. Journal of Emotional and Behavioral Disorders, 21(3). https://journals.sagepub.com/doi/10.1177/1063426611421007
- [1] Education Review Office. (2024). Ongoing research on new teachers (forthcoming publication)
- [1] Jang-Jones, A., & McGregor, A. (2019). PISA 2018 New Zealand students’ wellbeing school climate & student mindsets of 15-year-old. https://www.educationcounts.govt.nz/__data/assets/pdf_file/0005/196628/PISA-2018-NZ-Students-Wellbeing.pdf
- [1] Education Counts. (n.d.). Stand-downs, suspensions, exclusions and expulsions from school. Retrieved February 2024, from https://www.educationcounts.govt.nz/statistics/stand-downs,-suspensions,-exclusions-and-expulsions
- [1] Ogundari, K. (2023). Student Access to Technology at Home and Learning Hours During COVID-19 in the U.S. Educational Research for Policy and Practice. https://www.ncbi.nlm.nih.gov/pmc/articles/PMC10176282/
- [1] Schwartz, K. D. et al. (2021). COVID-19 and Student Well-Being: Stress and Mental Health during Return-to-School. Canadian Journal of School Psychology, 36(2), 166–185. https://journals.sagepub.com/doi/pdf/10.1177/08295735211001653
- [1] (n.d.). The annual report of His Majesty’s Chief Inspector of Education, children’s services and skills 2022/23. https://assets.publishing.service.gov.uk/media/655f2551c39e5a001392e4ca/31587_Ofsted_Annual_Report_2022-23_WEB.pdf
- [1] Mental Health Foundation of New Zealand. (n.d.). Statistics on mental health in schools in New Zealand. https://mentalhealth.org.nz/statistics-on-mental-health-in-schools-in-new-zealand
- [1] Schwartz, K. D. et al. (2021). COVID-19 and Student Well-Being: Stress and Mental Health during Return-to-School. Canadian Journal of School Psychology, 36(2), 166–185. https://journals.sagepub.com/doi/pdf/10.1177/08295735211001653
- [1] The Education Hub. (2023, August 24). Understanding mental health and wellbeing in upper secondary school students. https://theeducationhub.org.nz/understanding-mental-health-and-wellbeing-in-upper-secondary-school-students/
- [1] Education Review Office. (2023). Long Covid: Ongoing impacts of covid-19 on schools and learning. https://ero.govt.nz/our-research/long-covid-ongoing-impacts-of-covid-19-on-schools-and-learning
- [1] The Education Hub. (2023, August 24). Understanding mental health and wellbeing in upper secondary school students. https://theeducationhub.org.nz/understanding-mental-health-and-wellbeing-in-upper-secondary-school-students/
- [1] Education Review Office. (2022). Thriving at school? Education for disabled learners in schools. https://ero.govt.nz/our-research/thriving-at-school-education-for-disabled-learners-in-schools
- [1] Education Review Office. (2022). Thriving at school? Education for disabled learners in schools. https://ero.govt.nz/our-research/thriving-at-school-education-for-disabled-learners-in-schools
- [1] Khan, F. N., Begum, M., & Imad, M. (2019). Relationship Between Students’ Home Environment and their Academic Achievement at Secondary School Level. Pakistan Journal of Distance & Online Learning, 51(2), 223–234. https://files.eric.ed.gov/fulltext/EJ1266643.pdf
- [1] Ellis, G. (2023). Impact of students’ home lives on students’ academic performance and discussion of related strategies for teachers. https://digitalcommons.liberty.edu/cgi/viewcontent.cgi?article=2363&context=honors
- [1] Badri, M., et al. (2014). The Causal Relationship Between Parental Involvement and Children’s Behavioural Adjustment to KG-1 Schooling. International Journal of Child Care and Education Policy, 8(3). https://ijccep.springeropen.com/articles/10.1007/s40723-014-0003-6
- [1] Jonnatan, L., Seaton, C. L., Rush, K. L., & Li, E. P. H. (2022). Mobile Device Usage before and during the COVID-19 Pandemic among Rural and Urban Adults. International Journal of Environmental Research and Public Health, 19(14). https://www.ncbi.nlm.nih.gov/pmc/articles/PMC9315523/#:~:text=It%20is%20clear%20that%20Internet,to%20this%20increase%20%5B12%5D.
OECD. (2020). Keeping the Internet up and running in times of crisis. https://read.oecd-ilibrary.org/view/?ref=130_130768-5vgoglwswy&title=Keeping-the-Internet-up-and-running-in_times-of-crisis
- [1] Ogundari, K. (2023). Student Access to Technology at Home and Learning Hours During COVID-19 in the U.S. Educational Research for Policy and Practice. https://www.ncbi.nlm.nih.gov/pmc/articles/PMC10176282/
- [1] Lodha, P., & Pandya, A. (2021). Social connectedness, excessive screen time during COVID-19 and mental health: A Review of current evidence. In https://www.frontiersin.org/articles/10.3389/fhumd.2021.684137/full.
- [1] Regis College. (2023, June 30). Effects of technology on children during a pandemic. https://online.regiscollege.edu/blog/effects-of-technology-on-children/
- [1] Education Review Office. (2024). Ongoing research on new teachers (forthcoming publication).
- [1] Medina, E. (2023). PISA 2022: Mathematics achievement and experiences of 15-year-olds. Ministry of Education. https://www.educationcounts.govt.nz/__data/assets/pdf_file/0005/224609/PISA-2022-Mathematics-achievement-and-experiences-report.pdf
- [1] Education Review Office. (2023). “Everything was new”: Preparing and supporting new principals. https://ero.govt.nz/our-research/everything-was-new-preparing-and-supporting-new-principals
- [1] Education Review Office. (2021). Learning in a Covid-19 world: The impact of covid-19 on schools. https://ero.govt.nz/our-research/learning-in-a-covid-19-world-the-impact-of-covid-19-on-schools
- [1] Education Review Office. (2021). Learning in a Covid-19 world: The impact of covid-19 on schools. https://ero.govt.nz/our-research/learning-in-a-covid-19-world-the-impact-of-covid-19-on-schools
- [1] Ministry of Education. (2009). Guidelines for principals and boards of trustees on stand-downs, suspensions, exclusions and expulsions - Part 1: Legal options and duties. https://assets.education.govt.nz/public/Documents/School/Managing-and-supporting-students/Stand-downs-suspensions-exclusions-and-expulsions-guidelines/SuspensionLegalGuideWEB.pdf
Ministry of Education. (n.d.). Stand-downs, suspensions, exclusions, expulsions. For parents and whānau. https://parents.education.govt.nz/secondary-school/your-child-at-school/standdowns-suspensions-exclusions-expulsions/#:~:text=Yes.,kura%20as%20a%20last%20resort.
- [1] Education Counts. (2024). Stand-downs, suspensions, exclusions and expulsions. https://www.educationcounts.govt.nz/__data/assets/pdf_file/0010/208396/SSEE-2022-Indicator-Report.pdf
- [1] Leete, N. S. (2022). New Zealand secondary school principals’ understanding and application of laws relating to student discipline: A socio-legal mixed methods Study.https://ir.canterbury.ac.nz/server/api/core/bitstreams/8d3a5fb1-48d5-4581-b6bd-229b4b33488c/content
- [1] Agnew, S., Coupé, T., & Hingston, C.R. (2022). Predictors of school exclusion as a disciplinary measure in New Zealand: A Māori, pacific peoples and pakeha comparison. University of Canterbury. https://repec.canterbury.ac.nz/cbt/econwp/2214.pdf
- [1] Clunies-Ross, P., & Little, E. (2008). Self-reported and Actual Use of Proactive and Reactive Classroom Management Strategies and Their Relationship with Teacher Stress and Student Behaviour. Educational Psychology, 28(6), 693–710.
Bowden, N. et al. (2022). Association Between High-Need Education-Based Funding and School Suspension Rates for Autistic Students in New Zealand. JAMA Pediatrics, 176(5). https://www.researchgate.net/publication/360633034_Association_Between_High-Need_Education-Based_Funding_and_School_Suspension_Rates_for_Autistic_Students_in_New_Zealand
- [1] Education Review Office. (2024). Ongoing research on new teachers (forthcoming publication)
- [1] Education Review Office. (2024). Ongoing research on new teachers (forthcoming publication).
- [1] Education Review Office. (2023). “Everything was new”: Preparing and supporting new principals. https://ero.govt.nz/our-research/everything-was-new-preparing-and-supporting-new-principals
- [1] Clunies-Ross, P., & Little, E. (2008). Self-reported and Actual Use of Proactive and Reactive Classroom Management Strategies and Their Relationship with Teacher Stress and Student Behaviour. Educational Psychology, 28(6), 693–710.
- [1] Allan, D. et al. (2009). Predictors of Restrictive Reactive Strategy Use in People with Challenging Behaviour. Journal of Applied Research in Intellectual Disabilities, 22(2), 159–168. https://www.researchgate.net/publication/229964972_Predictors_of_Restrictive_Reactive_Strategy_Use_in_People_with_Challenging_Behaviour
- [1] Allan, D. et al. (2009). Predictors of Restrictive Reactive Strategy Use in People with Challenging Behaviour. Journal of Applied Research in Intellectual Disabilities, 22(2), 159–168. https://www.researchgate.net/publication/229964972_Predictors_of_Restrictive_Reactive_Strategy_Use_in_People_with_Challenging_Behaviour
- [1] Ministry of Education. (n.d.). Build relationships with students based on trust and mutual respect. TKI. https://inclusive.tki.org.nz/guides/behaviour-and-learning/build-relationships-with-students-based-on-trust-and-mutual-respect/
Evidence for Learning. (2023). Effective behaviour supports in schools. https://d288jieqo2x7eq.cloudfront.net/e4l-guidance-reports/effective-behaviour-supports-in-schools/Effective-Behaviour-Guidance-Report.pdf?v=1678155642Education Endowment Foundation. (2021). Improving behaviour in schools. https://d2tic4wvo1iusb.cloudfront.net/production/eef-guidance-reports/behaviour/EEF_Improving_behaviour_in_schools_Report.pdf?v=1691338569
- [1] Rohan, T. (2017). Teaching For Positive Behaviour: Supporting engagement, participation, and learning. Ministry of Education.
Ministry of Education. (n.d.). Behaviour and learning. TKI. https://inclusive.tki.org.nz/guides/behaviour-and-learning/#foster-positive-relationships-and-partnerships
- [1] Evidence for Learning. (2023). Effective behaviour supports in schools. https://d288jieqo2x7eq.cloudfront.net/e4l-guidance-reports/effective-behaviour-supports-in-schools/Effective-Behaviour-Guidance-Report.pdf?v=1678155642
- [1] Education Endowment Foundation. (2021). Improving behaviour in schools. https://d2tic4wvo1iusb.cloudfront.net/production/eef-guidance-reports/behaviour/EEF_Improving_behaviour_in_schools_Report.pdf?v=1691338569
- [1] Rohan, T. (2017). Teaching for positive behaviour: Supporting engagement, participation, and learning. Ministry of Education.
- [1] Evidence for Learning. (2023). Effective behaviour supports in schools. https://d288jieqo2x7eq.cloudfront.net/e4l-guidance-reports/effective-behaviour-supports-in-schools/Effective-Behaviour-Guidance-Report.pdf?v=1678155642
- [1] Evidence for Learning. (2023). Effective behaviour supports in schools. https://d288jieqo2x7eq.cloudfront.net/e4l-guidance-reports/effective-behaviour-supports-in-schools/Effective-Behaviour-Guidance-Report.pdf?v=1678155642
- [1] Rohan, T. (2017). Teaching for positive behaviour: Supporting engagement, participation, and learning. Ministry of Education.
- [1] Evidence for Learning. (2023). Effective behaviour supports in schools. https://d288jieqo2x7eq.cloudfront.net/e4l-guidance-reports/effective-behaviour-supports-in-schools/Effective-Behaviour-Guidance-Report.pdf?v=1678155642
Rohan, T. (2017). Teaching for positive behaviour: Supporting engagement, participation, and learning. Ministry of Education.
Education Endowment Foundation. (2021). Improving behaviour in schools. https://d2tic4wvo1iusb.cloudfront.net/production/eef-guidance-reports/behaviour/EEF_Improving_behaviour_in_schools_Report.pdf?v=1691338569
- [1] Evidence for Learning. (2023). Effective behaviour supports in schools. https://d288jieqo2x7eq.cloudfront.net/e4l-guidance-reports/effective-behaviour-supports-in-schools/Effective-Behaviour-Guidance-Report.pdf?v=1678155642
- [1] Allan, D. et al. (2009). Predictors of Restrictive Reactive Strategy Use in People with Challenging Behaviour. Journal of Applied Research in Intellectual Disabilities, 22(2), 159–168. https://www.researchgate.net/publication/229964972_Predictors_of_Restrictive_Reactive_Strategy_Use_in_People_with_Challenging_Behaviour
- [1]Rohan, T. (2017). Teaching for positive behaviour: supporting engagement, participation, and learning. Ministry of Education.
- [1] Ministry of Education. (n.d.). Behaviour support - information for teachers and schools. https://www.education.govt.nz/school/student-support/special-education/behaviour-services-to-help-schools-and-students/behaviour-services-and-support/behaviour-support-information-for-teachers-and-schools/
Ministry of Education. (n.d.). Interim response fund (IRF). https://www.education.govt.nz/school/funding-and-financials/resourcing/interim-response-fund-irf/
Ministry of Education. (n.d.). Te Kahu Tōī: Intensive wraparound service. https://www.education.govt.nz/school/student-support/special-education/intensive-wraparound-service-iws/
Ministry of Education. (n.d.). Te Kahu Tōī: intensive wraparound service. https://www.education.govt.nz/school/student-support/special-education/intensive-wraparound-service-iws/
- [1] Education Endowment Foundation. (2021). Improving behaviour in schools. https://d2tic4wvo1iusb.cloudfront.net/production/eef-guidance-reports/behaviour/EEF_Improving_behaviour_in_schools_Report.pdf?v=1691338569
- [1] Evidence for Learning. (2023). Effective behaviour supports in schools. https://d288jieqo2x7eq.cloudfront.net/e4l-guidance-reports/effective-behaviour-supports-in-schools/Effective-Behaviour-Guidance-Report.pdf?v=1678155642
- [1] Education Endowment Foundation. (2021). Improving behaviour in schools. https://d2tic4wvo1iusb.cloudfront.net/production/eef-guidance-reports/behaviour/EEF_Improving_behaviour_in_schools_Report.pdf?v=1691338569
- [1] Stats NZ. (2022). Experimental administrative population census: Data sources, methods, and quality (second iteration). https://www.stats.govt.nz/research/experimental-administrative-population-census-data-sources-methods-and-quality-second-iteration/
- [1] Social Wellbeing Agency. (2023). Experiences and outcomes of Alternative Education participants. https://www.swa.govt.nz/publications/Experiences-and-outcomes-of-Alternative-Education-participants#:~:text=This%20analysis%20shows%20young%20people,group%20we%20compared%20them%20with.
- [1] Education Counts. (2023). Teacher numbers. https://www.educationcounts.govt.nz/statistics/teacher-numbers
- [1] Education Counts. (2023). Teacher numbers. https://www.educationcounts.govt.nz/statistics/teacher-numbers
- [1] Centre for Education Statistics and Evaluation. (n.d.). Classroom management: Creating and maintaining positive learning environments. New South Wales Department of Education. https://education.nsw.gov.au/content/dam/main-education/about-us/educational-data/cese/2020-classroom-management-literature-review.pdf
Korpershoek, H., et al. (2019). The Relationships between School Belonging and Students' Motivational, Social-Emotional, Behavioural, and Academic Outcomes in Secondary Education: a Meta-Analytic Review. Papers in Education. 35, 641–680. doi:10.1080/02671522.2019.1615116
- [1] Ministry of Education. (n.d.). Behaviour and learning. TKI. https://inclusive.tki.org.nz/guides/behaviour-and-learning/#foster-positive-relationships-and-partnerships
- [1] Nwoko, J. C., et al. (n.d.). A Systematic Review of the Factors That Influence Teachers’ Occupational Wellbeing. International Journal of Environmental Research and Public Health, 20(12). https://www.ncbi.nlm.nih.gov/pmc/articles/PMC10298565/
- [1] Centre for Education Statistics and Evaluation. (n.d.). Classroom management: Creating and maintaining positive learning environments. New South Wales Department of Education. https://education.nsw.gov.au/content/dam/main-education/about-us/educational-data/cese/2020-classroom-management-literature-review.pdf
- [1] Sugai, G., & Horner, R. H. (2009). Defining and Describing Schoolwide Positive Behavior Support. In Handbook of Positive Behavior Support. Springer. https://link.springer.com/chapter/10.1007/978-0-387-09632-2_13#citeas
- [1] Ministry of Education. (n.d.). Stand-downs, suspensions, exclusions and expulsions guidelines – Part 1. https://www.education.govt.nz/school/managing-and-supporting-students/student-behaviour-help-and-guidance/stand-downs-suspensions-exclusions-and-expulsions-guidelines/principals-role/principals-decision/
- [1] (Education and Training Act 2020)
- [1] Ministry of Education. (n.d.). Stand-downs, suspensions, exclusions and expulsions guidelines – Part 1. https://www.education.govt.nz/school/managing-and-supporting-students/student-behaviour-help-and-guidance/stand-downs-suspensions-exclusions-and-expulsions-guidelines/principals-role/principals-decision/
- [1] Education Counts. (n.d.). Stand-downs, suspensions, exclusions and expulsions from school. Retrieved February 2024, from https://www.educationcounts.govt.nz/statistics/stand-downs,-suspensions,-exclusions-and-expulsions
- [1] Medina, E. (2023). PISA 2022: Mathematics achievement and experiences of 15-year-olds. Ministry of Education. https://www.educationcounts.govt.nz/__data/assets/pdf_file/0005/224609/PISA-2022-Mathematics-achievement-and-experiences-report.pdf
- [1] Sturrock, F., May, S., & Comparative Education Research Unit, Ministry of Education. (2002). PISA 2000: The New Zealand context. Education Counts. https://www.educationcounts.govt.nz/publications/series/2543/PISA_2000/5275
- [1] Ministry of Education. (2002). PISA 2000: Overview of selected New Zealand Findings]. https://www.educationcounts.govt.nz/__data/assets/pdf_file/0020/7508/PISA-2000-Overview-of-selected-New-Zealand-findings.pdf
- [1] Ministry of Education. (2003). Learning for tomorrow’s world: Programme for international student assessment (pisa) 2003 - New Zealand summary report. https://www.educationcounts.govt.nz/__data/assets/pdf_file/0003/6987/PISA-2003-Learning-for-tomorrows-world-New-Zealand-Summary-Report.pdf
- [1] Telford, M. (n.d.). PISA 2009 reading to learn: New Zealand 15-year-olds’ reading habits, learning approaches and experiences of teaching practices. Ministry of Education. https://www.educationcounts.govt.nz/__data/assets/pdf_file/0013/116203/PISA-2009-Reading-to-Learn-Part-1.pdfhttps://www.educationcounts.govt.nz/__data/assets/pdf_file/0013/116203/PISA-2009-Reading-to-Learn-Part-1.pdf
- [1] (2009). Reading to learn. Https://Www.educationcounts.govt.nz/__data/Assets/Pdf_file/0014/116204/PISA-2009-Reading-To-Learn-Part-2.Pdf.
- [1] Lamy, M., & May, S. (2012). PISA 2012 series on the learning environment, volume iii: student behaviour. Ministry of Education. https://www.educationcounts.govt.nz/__data/assets/pdf_file/0018/146205/PISA-2012-Series-on-the-Learning-Environment-Vol-III-Student-Behaviour.pdf
- [1] Jang-Jones, A., & McGregor, A. (2019). PISA 2018 New Zealand students’ wellbeing school climate & student mindsets of 15-year-old. https://www.educationcounts.govt.nz/__data/assets/pdf_file/0005/196628/PISA-2018-NZ-Students-Wellbeing.pdf
- [1] Medina, E. (2023). PISA 2022: Mathematics achievement and experiences of 15-year-olds. Ministry of Education. https://www.educationcounts.govt.nz/__data/assets/pdf_file/0005/224609/PISA-2022-Mathematics-achievement-and-experiences-report.pdf
- [1] Leete, N. S. (2022). New Zealand secondary school principals’ understanding and application of laws relating to student discipline: a socio-legal mixed methods study.https://ir.canterbury.ac.nz/server/api/core/bitstreams/8d3a5fb1-48d5-4581-b6bd-229b4b33488c/content
- [1] Education Counts. (n.d.). Stand-downs, suspensions, exclusions and expulsions from school. Retrieved February 2024, from https://www.educationcounts.govt.nz/statistics/stand-downs,-suspensions,-exclusions-and-expulsions
- [1] Acar, I. H., et al. (2022). Can You See Me at My Worst? A Latent Profile Analysis Of Students And Teachers’ Perceptions Of Student Behavior Problems. Current Psychology, 42(7).
- [1] Gateways School. (n.d.). Benefits of having a small school community. https://www.gatewaysschool.co.uk/benefits-small-school-community/
- [1] Manpower Demonstration Research Corporation. (n.d.). New York City Small Schools of Choice Evaluation. https://www.mdrc.org/work/projects/new-york-city-small-schools-choice-evaluation#featured_content
- [1] The Research Alliance for New York City Schools. (n.d.). Understanding the impact of small high schools of choice. NYU Steinhardt. https://steinhardt.nyu.edu/research-alliance/research/projects/understanding-impact-small-high-schools-choice
- [1] Bloom, H. S., & Unterman, R. (2014). Can Small High Schools of Choice Improve Educational Prospects for Disadvantaged Students?. Journal of Policy Analysis and Management, 33(2). https://www.researchgate.net/publication/260531250_Can_Small_High_Schools_of_Choice_Improve_Educational_Prospects_for_Disadvantaged_Students/citation/download
- [1] Barry, A. et al. (2017). Trade offs and solutions: investigating survival strategies and decision-making to mediate the effects of poverty in whānau. https://www.otago.ac.nz/__data/assets/pdf_file/0030/332499/trade-offs-and-solutions-investigating-survival-strategies-and-decision-making-to-mediate-the-effects-of-poverty-in-whanau-640012.pdf
- [1] Flouri, E., & Midouhas, E. (2016). School Composition, Family Poverty and Child Behaviour. Social Psychiatry and Psychiatric Epidemiology, 51(6), 817–826. https://www.ncbi.nlm.nih.gov/pmc/articles/PMC4889629/
Letourneau, N. L. et al. (2013). Socioeconomic Status and Child Development: A Meta-Analysis. Journal of Emotional and Behavioral Disorders, 21(3). https://journals.sagepub.com/doi/10.1177/1063426611421007
- [1] Education Review Office. (2024). Ongoing research on new teachers (forthcoming publication)
- [1] Jang-Jones, A., & McGregor, A. (2019). PISA 2018 New Zealand students’ wellbeing school climate & student mindsets of 15-year-old. https://www.educationcounts.govt.nz/__data/assets/pdf_file/0005/196628/PISA-2018-NZ-Students-Wellbeing.pdf
- [1] Education Counts. (n.d.). Stand-downs, suspensions, exclusions and expulsions from school. Retrieved February 2024, from https://www.educationcounts.govt.nz/statistics/stand-downs,-suspensions,-exclusions-and-expulsions
- [1] Ogundari, K. (2023). Student Access to Technology at Home and Learning Hours During COVID-19 in the U.S. Educational Research for Policy and Practice. https://www.ncbi.nlm.nih.gov/pmc/articles/PMC10176282/
- [1] Schwartz, K. D. et al. (2021). COVID-19 and Student Well-Being: Stress and Mental Health during Return-to-School. Canadian Journal of School Psychology, 36(2), 166–185. https://journals.sagepub.com/doi/pdf/10.1177/08295735211001653
- [1] (n.d.). The annual report of His Majesty’s Chief Inspector of Education, children’s services and skills 2022/23. https://assets.publishing.service.gov.uk/media/655f2551c39e5a001392e4ca/31587_Ofsted_Annual_Report_2022-23_WEB.pdf
- [1] Mental Health Foundation of New Zealand. (n.d.). Statistics on mental health in schools in New Zealand. https://mentalhealth.org.nz/statistics-on-mental-health-in-schools-in-new-zealand
- [1] Schwartz, K. D. et al. (2021). COVID-19 and Student Well-Being: Stress and Mental Health during Return-to-School. Canadian Journal of School Psychology, 36(2), 166–185. https://journals.sagepub.com/doi/pdf/10.1177/08295735211001653
- [1] The Education Hub. (2023, August 24). Understanding mental health and wellbeing in upper secondary school students. https://theeducationhub.org.nz/understanding-mental-health-and-wellbeing-in-upper-secondary-school-students/
- [1] Education Review Office. (2023). Long Covid: Ongoing impacts of covid-19 on schools and learning. https://ero.govt.nz/our-research/long-covid-ongoing-impacts-of-covid-19-on-schools-and-learning
- [1] The Education Hub. (2023, August 24). Understanding mental health and wellbeing in upper secondary school students. https://theeducationhub.org.nz/understanding-mental-health-and-wellbeing-in-upper-secondary-school-students/
- [1] Education Review Office. (2022). Thriving at school? Education for disabled learners in schools. https://ero.govt.nz/our-research/thriving-at-school-education-for-disabled-learners-in-schools
- [1] Education Review Office. (2022). Thriving at school? Education for disabled learners in schools. https://ero.govt.nz/our-research/thriving-at-school-education-for-disabled-learners-in-schools
- [1] Khan, F. N., Begum, M., & Imad, M. (2019). Relationship Between Students’ Home Environment and their Academic Achievement at Secondary School Level. Pakistan Journal of Distance & Online Learning, 51(2), 223–234. https://files.eric.ed.gov/fulltext/EJ1266643.pdf
- [1] Ellis, G. (2023). Impact of students’ home lives on students’ academic performance and discussion of related strategies for teachers. https://digitalcommons.liberty.edu/cgi/viewcontent.cgi?article=2363&context=honors
- [1] Badri, M., et al. (2014). The Causal Relationship Between Parental Involvement and Children’s Behavioural Adjustment to KG-1 Schooling. International Journal of Child Care and Education Policy, 8(3). https://ijccep.springeropen.com/articles/10.1007/s40723-014-0003-6
- [1] Jonnatan, L., Seaton, C. L., Rush, K. L., & Li, E. P. H. (2022). Mobile Device Usage before and during the COVID-19 Pandemic among Rural and Urban Adults. International Journal of Environmental Research and Public Health, 19(14). https://www.ncbi.nlm.nih.gov/pmc/articles/PMC9315523/#:~:text=It%20is%20clear%20that%20Internet,to%20this%20increase%20%5B12%5D.
OECD. (2020). Keeping the Internet up and running in times of crisis. https://read.oecd-ilibrary.org/view/?ref=130_130768-5vgoglwswy&title=Keeping-the-Internet-up-and-running-in_times-of-crisis
- [1] Ogundari, K. (2023). Student Access to Technology at Home and Learning Hours During COVID-19 in the U.S. Educational Research for Policy and Practice. https://www.ncbi.nlm.nih.gov/pmc/articles/PMC10176282/
- [1] Lodha, P., & Pandya, A. (2021). Social connectedness, excessive screen time during COVID-19 and mental health: A Review of current evidence. In https://www.frontiersin.org/articles/10.3389/fhumd.2021.684137/full.
- [1] Regis College. (2023, June 30). Effects of technology on children during a pandemic. https://online.regiscollege.edu/blog/effects-of-technology-on-children/
- [1] Education Review Office. (2024). Ongoing research on new teachers (forthcoming publication).
- [1] Medina, E. (2023). PISA 2022: Mathematics achievement and experiences of 15-year-olds. Ministry of Education. https://www.educationcounts.govt.nz/__data/assets/pdf_file/0005/224609/PISA-2022-Mathematics-achievement-and-experiences-report.pdf
- [1] Education Review Office. (2023). “Everything was new”: Preparing and supporting new principals. https://ero.govt.nz/our-research/everything-was-new-preparing-and-supporting-new-principals
- [1] Education Review Office. (2021). Learning in a Covid-19 world: The impact of covid-19 on schools. https://ero.govt.nz/our-research/learning-in-a-covid-19-world-the-impact-of-covid-19-on-schools
- [1] Education Review Office. (2021). Learning in a Covid-19 world: The impact of covid-19 on schools. https://ero.govt.nz/our-research/learning-in-a-covid-19-world-the-impact-of-covid-19-on-schools
- [1] Ministry of Education. (2009). Guidelines for principals and boards of trustees on stand-downs, suspensions, exclusions and expulsions - Part 1: Legal options and duties. https://assets.education.govt.nz/public/Documents/School/Managing-and-supporting-students/Stand-downs-suspensions-exclusions-and-expulsions-guidelines/SuspensionLegalGuideWEB.pdf
Ministry of Education. (n.d.). Stand-downs, suspensions, exclusions, expulsions. For parents and whānau. https://parents.education.govt.nz/secondary-school/your-child-at-school/standdowns-suspensions-exclusions-expulsions/#:~:text=Yes.,kura%20as%20a%20last%20resort.
- [1] Education Counts. (2024). Stand-downs, suspensions, exclusions and expulsions. https://www.educationcounts.govt.nz/__data/assets/pdf_file/0010/208396/SSEE-2022-Indicator-Report.pdf
- [1] Leete, N. S. (2022). New Zealand secondary school principals’ understanding and application of laws relating to student discipline: A socio-legal mixed methods Study.https://ir.canterbury.ac.nz/server/api/core/bitstreams/8d3a5fb1-48d5-4581-b6bd-229b4b33488c/content
- [1] Agnew, S., Coupé, T., & Hingston, C.R. (2022). Predictors of school exclusion as a disciplinary measure in New Zealand: A Māori, pacific peoples and pakeha comparison. University of Canterbury. https://repec.canterbury.ac.nz/cbt/econwp/2214.pdf
- [1] Clunies-Ross, P., & Little, E. (2008). Self-reported and Actual Use of Proactive and Reactive Classroom Management Strategies and Their Relationship with Teacher Stress and Student Behaviour. Educational Psychology, 28(6), 693–710.
Bowden, N. et al. (2022). Association Between High-Need Education-Based Funding and School Suspension Rates for Autistic Students in New Zealand. JAMA Pediatrics, 176(5). https://www.researchgate.net/publication/360633034_Association_Between_High-Need_Education-Based_Funding_and_School_Suspension_Rates_for_Autistic_Students_in_New_Zealand
- [1] Education Review Office. (2024). Ongoing research on new teachers (forthcoming publication)
- [1] Education Review Office. (2024). Ongoing research on new teachers (forthcoming publication).
- [1] Education Review Office. (2023). “Everything was new”: Preparing and supporting new principals. https://ero.govt.nz/our-research/everything-was-new-preparing-and-supporting-new-principals
- [1] Clunies-Ross, P., & Little, E. (2008). Self-reported and Actual Use of Proactive and Reactive Classroom Management Strategies and Their Relationship with Teacher Stress and Student Behaviour. Educational Psychology, 28(6), 693–710.
- [1] Allan, D. et al. (2009). Predictors of Restrictive Reactive Strategy Use in People with Challenging Behaviour. Journal of Applied Research in Intellectual Disabilities, 22(2), 159–168. https://www.researchgate.net/publication/229964972_Predictors_of_Restrictive_Reactive_Strategy_Use_in_People_with_Challenging_Behaviour
- [1] Allan, D. et al. (2009). Predictors of Restrictive Reactive Strategy Use in People with Challenging Behaviour. Journal of Applied Research in Intellectual Disabilities, 22(2), 159–168. https://www.researchgate.net/publication/229964972_Predictors_of_Restrictive_Reactive_Strategy_Use_in_People_with_Challenging_Behaviour
- [1] Ministry of Education. (n.d.). Build relationships with students based on trust and mutual respect. TKI. https://inclusive.tki.org.nz/guides/behaviour-and-learning/build-relationships-with-students-based-on-trust-and-mutual-respect/
Evidence for Learning. (2023). Effective behaviour supports in schools. https://d288jieqo2x7eq.cloudfront.net/e4l-guidance-reports/effective-behaviour-supports-in-schools/Effective-Behaviour-Guidance-Report.pdf?v=1678155642Education Endowment Foundation. (2021). Improving behaviour in schools. https://d2tic4wvo1iusb.cloudfront.net/production/eef-guidance-reports/behaviour/EEF_Improving_behaviour_in_schools_Report.pdf?v=1691338569
- [1] Rohan, T. (2017). Teaching For Positive Behaviour: Supporting engagement, participation, and learning. Ministry of Education.
Ministry of Education. (n.d.). Behaviour and learning. TKI. https://inclusive.tki.org.nz/guides/behaviour-and-learning/#foster-positive-relationships-and-partnerships
- [1] Evidence for Learning. (2023). Effective behaviour supports in schools. https://d288jieqo2x7eq.cloudfront.net/e4l-guidance-reports/effective-behaviour-supports-in-schools/Effective-Behaviour-Guidance-Report.pdf?v=1678155642
- [1] Education Endowment Foundation. (2021). Improving behaviour in schools. https://d2tic4wvo1iusb.cloudfront.net/production/eef-guidance-reports/behaviour/EEF_Improving_behaviour_in_schools_Report.pdf?v=1691338569
- [1] Rohan, T. (2017). Teaching for positive behaviour: Supporting engagement, participation, and learning. Ministry of Education.
- [1] Evidence for Learning. (2023). Effective behaviour supports in schools. https://d288jieqo2x7eq.cloudfront.net/e4l-guidance-reports/effective-behaviour-supports-in-schools/Effective-Behaviour-Guidance-Report.pdf?v=1678155642
- [1] Evidence for Learning. (2023). Effective behaviour supports in schools. https://d288jieqo2x7eq.cloudfront.net/e4l-guidance-reports/effective-behaviour-supports-in-schools/Effective-Behaviour-Guidance-Report.pdf?v=1678155642
- [1] Rohan, T. (2017). Teaching for positive behaviour: Supporting engagement, participation, and learning. Ministry of Education.
- [1] Evidence for Learning. (2023). Effective behaviour supports in schools. https://d288jieqo2x7eq.cloudfront.net/e4l-guidance-reports/effective-behaviour-supports-in-schools/Effective-Behaviour-Guidance-Report.pdf?v=1678155642
Rohan, T. (2017). Teaching for positive behaviour: Supporting engagement, participation, and learning. Ministry of Education.
Education Endowment Foundation. (2021). Improving behaviour in schools. https://d2tic4wvo1iusb.cloudfront.net/production/eef-guidance-reports/behaviour/EEF_Improving_behaviour_in_schools_Report.pdf?v=1691338569
- [1] Evidence for Learning. (2023). Effective behaviour supports in schools. https://d288jieqo2x7eq.cloudfront.net/e4l-guidance-reports/effective-behaviour-supports-in-schools/Effective-Behaviour-Guidance-Report.pdf?v=1678155642
- [1] Allan, D. et al. (2009). Predictors of Restrictive Reactive Strategy Use in People with Challenging Behaviour. Journal of Applied Research in Intellectual Disabilities, 22(2), 159–168. https://www.researchgate.net/publication/229964972_Predictors_of_Restrictive_Reactive_Strategy_Use_in_People_with_Challenging_Behaviour
- [1]Rohan, T. (2017). Teaching for positive behaviour: supporting engagement, participation, and learning. Ministry of Education.
- [1] Ministry of Education. (n.d.). Behaviour support - information for teachers and schools. https://www.education.govt.nz/school/student-support/special-education/behaviour-services-to-help-schools-and-students/behaviour-services-and-support/behaviour-support-information-for-teachers-and-schools/
Ministry of Education. (n.d.). Interim response fund (IRF). https://www.education.govt.nz/school/funding-and-financials/resourcing/interim-response-fund-irf/
Ministry of Education. (n.d.). Te Kahu Tōī: Intensive wraparound service. https://www.education.govt.nz/school/student-support/special-education/intensive-wraparound-service-iws/
Ministry of Education. (n.d.). Te Kahu Tōī: intensive wraparound service. https://www.education.govt.nz/school/student-support/special-education/intensive-wraparound-service-iws/
- [1] Education Endowment Foundation. (2021). Improving behaviour in schools. https://d2tic4wvo1iusb.cloudfront.net/production/eef-guidance-reports/behaviour/EEF_Improving_behaviour_in_schools_Report.pdf?v=1691338569
- [1] Evidence for Learning. (2023). Effective behaviour supports in schools. https://d288jieqo2x7eq.cloudfront.net/e4l-guidance-reports/effective-behaviour-supports-in-schools/Effective-Behaviour-Guidance-Report.pdf?v=1678155642
- [1] Education Endowment Foundation. (2021). Improving behaviour in schools. https://d2tic4wvo1iusb.cloudfront.net/production/eef-guidance-reports/behaviour/EEF_Improving_behaviour_in_schools_Report.pdf?v=1691338569
- [1] Stats NZ. (2022). Experimental administrative population census: Data sources, methods, and quality (second iteration). https://www.stats.govt.nz/research/experimental-administrative-population-census-data-sources-methods-and-quality-second-iteration/
- [1] Social Wellbeing Agency. (2023). Experiences and outcomes of Alternative Education participants. https://www.swa.govt.nz/publications/Experiences-and-outcomes-of-Alternative-Education-participants#:~:text=This%20analysis%20shows%20young%20people,group%20we%20compared%20them%20with.
- [1] Education Counts. (2023). Teacher numbers. https://www.educationcounts.govt.nz/statistics/teacher-numbers
- [1] Education Counts. (2023). Teacher numbers. https://www.educationcounts.govt.nz/statistics/teacher-numbers